Ethereum Support Level Critical ETH Price Analysis 2026
Ethereum faces a crucial support test. Why this level matters for ETH Price Analysis 2026 what traders need to watch in 2026's volatile market.

Ethereum (ETH) stands as the second-largest cryptocurrency by market cap, serving as the backbone for decentralized finance (DeFi), ETH Price Analysis 2026: non-fungible tokens (NFTs), and countless blockchain applications. As we navigate through 2026, Ethereum finds itself at a pivotal juncture, testing a support level that could define its price action for months to come.
Understanding why certain price levels matter isn’t just an academic exercise for traders and investors. These critical support zones represent psychological barriers, accumulation areas, and technical foundations that have been tested repeatedly throughout Ethereum’s trading history. When a major support level breaks, it often triggers cascading liquidations, panic selling, and a fundamental shift in market sentiment. Conversely, when support holds firm, it can serve as a launchpad for significant recoveries and renewed bullish momentum.
This comprehensive analysis examines the current state of Ethereum’s price structure, the technical indicators signaling danger, the fundamental factors at play, and most importantly, why the current support level represents a line in the sand that bulls must defend at all costs. Whether you’re a long-term holder, active trader, or simply interested in understanding cryptocurrency market dynamics, the coming weeks could prove decisive for Ethereum’s medium-term outlook.
Ethereum’s Current Market Position: ETH Price Analysis 2026
Ethereum’s market dynamics have evolved considerably since its inception in 2015. What began as a platform for smart contracts has transformed into a multi-layered ecosystem supporting thousands of decentralized applications, layer-2 scaling solutions, and institutional-grade financial products. The network’s transition to proof-of-stake through The Merge fundamentally altered its economic model, introducing staking rewards, reduced issuance, and deflationary pressure during periods of high network activity.
Currently, ETH is testing a support zone that has historical significance dating back multiple market cycles. This level represents not just an arbitrary price point, but a confluence of technical factors, including previous resistance turned support, high-volume nodes from on-chain data, and key Fibonacci retracement levels from the last major rally. The Ethereum price action around this zone has shown signs of both strength and weakness, with aggressive buying appearing during initial tests, but follow-through remaining questionable.
Market structure analysis reveals that Ethereum has been forming a series of lower highs since reaching its recent peak, a concerning pattern that typically indicates waning bullish momentum. However, the support level in question has been defended multiple times, creating a horizontal base that could serve as accumulation territory for patient investors. The battle between buyers and sellers at this critical juncture reflects broader uncertainty about the cryptocurrency market direction amid changing macroeconomic conditions.
Technical Analysis: The Support Level Under Scrutiny
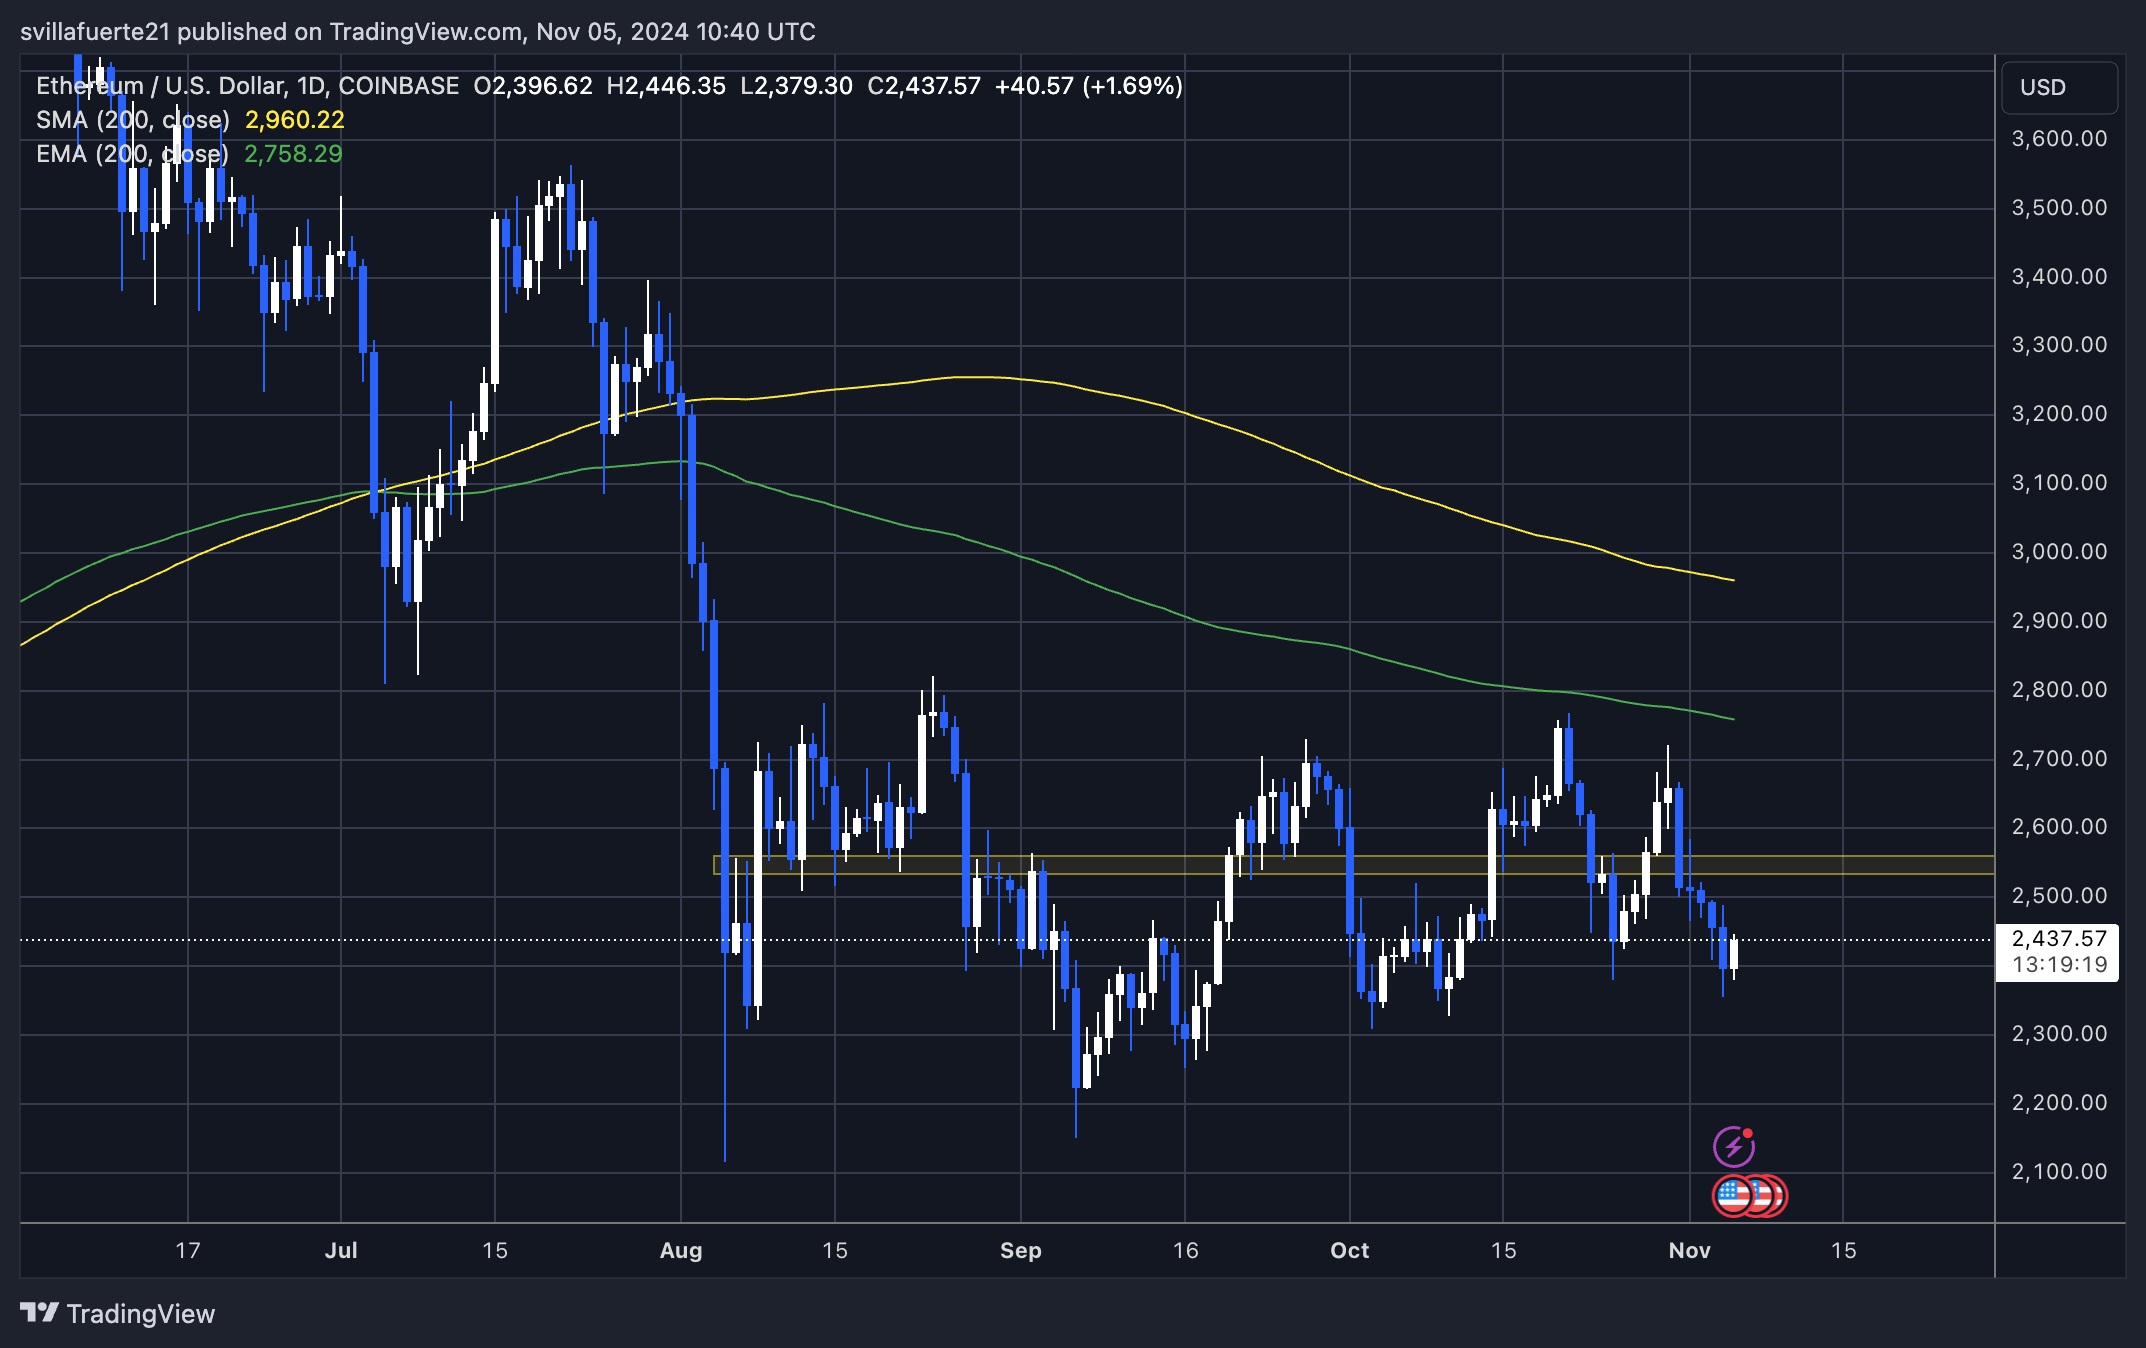
From a technical analysis perspective, the current support level represents a convergence of multiple indicators and historical price action that gives it outsized importance. This zone sits approximately at the 200-week moving average, a metric that has historically served as a reliable indicator of long-term trend direction for major cryptocurrencies. Throughout Bitcoin and Ethereum’s history, sustained breaks below this moving average have often signaled the transition into bear market territory.
Additionally, the support level aligns with a previous consolidation range that saw enormous trading volume. When prices spend extended periods at certain levels with heavy volume, these areas tend to act as significant support or resistance in the future because they represent a large number of participants who entered positions at those prices. These holders often defend their entry points aggressively, providing buying pressure when prices revisit these zones.
The relative strength index (RSI) and other momentum indicators show Ethereum hovering near oversold conditions on higher timeframes, suggesting that while short-term pressure remains bearish, conditions may be ripening for a reversal. However, oversold conditions can persist longer than many traders expect, especially during broader market downturns. The Ethereum technical indicators paint a picture of a market at an inflection point, where the next major move could establish the trend for the coming quarter.
On-Chain Metrics Revealing Critical Insights
Beyond traditional charting, on-chain analysis provides invaluable insights into what’s actually happening with Ethereum at the protocol level. One of the most telling metrics is the exchange netflow, which tracks whether ETH is moving onto or off of centralized exchanges. Recent data shows that despite price weakness, significant amounts of Ethereum continue to leave exchanges, typically a bullish signal indicating accumulation and reduced selling pressure.
The number of addresses holding ETH has continued to grow even as prices have declined, suggesting that new participants are entering the market and existing holders are expanding their positions. This accumulation pattern often precedes significant price recoveries, though timing remains uncertain. Additionally, staking metrics reveal that over 30% of all Ethereum supply is now locked in staking contracts, removing it from circulating supply and reducing potential selling pressure.
Network activity metrics present a more mixed picture. While transaction counts have decreased from peak levels, this reflects broader market malaise rather than fundamental weakness in Ethereum’s value proposition. Gas fees have remained relatively modest, making the network more accessible for everyday users and applications. The Ethereum network fundamentals remain strong even as price struggles, creating a disconnect that value investors often view as an opportunity.
Macroeconomic Factors Influencing Ethereum’s Price
The cryptocurrency market doesn’t exist in isolation, and understanding the broader macroeconomic environment is essential for contextualizing Ethereum’s current challenges. Global economic uncertainty, shifting monetary policy, and evolving regulatory landscapes all exert influence on digital asset prices. Central bank policies regarding interest rates directly impact investor appetite for risk assets, with cryptocurrencies typically thriving during periods of monetary expansion and struggling during tightening cycles.
Institutional participation in cryptocurrency markets has grown substantially, bringing with it correlations to traditional financial markets that didn’t exist in earlier cycles. When equity markets experience turbulence, that volatility often spills over into crypto assets, including Ethereum. This interconnectedness means that ETH price movements increasingly reflect not just crypto-specific factors but also broader risk sentiment across all asset classes.
Regulatory developments continue to shape market dynamics in profound ways. Clearer frameworks in major jurisdictions have provided both opportunities and constraints for Ethereum’s ecosystem. The classification of certain tokens, approaches to DeFi regulation, and treatment of staking rewards all influence how institutional and retail participants engage with the Ethereum network. These macro factors create a backdrop against which the current support level test is occurring, adding layers of complexity beyond pure technical analysis.
What Happens If Support Breaks?
Understanding the potential consequences of a support level failure is crucial for risk management. If the current Ethereum support level breaks decisively, with sustained trading below the zone accompanied by increasing volume, the technical implications would be significant. The next major support sits considerably lower, potentially creating a vacuum where prices could fall rapidly as stop-loss orders trigger and momentum traders pile into short positions.
A break of this magnitude would likely trigger a shift in market structure from consolidation to downtrend, potentially lasting weeks or months. Historical precedent suggests that major support breaks typically result in 20-40% declines before stabilizing at the next significant level. For Ethereum, this could mean testing price regions not seen since earlier in the current market cycle, shaking out leveraged positions and testing the conviction of long-term holders.
The psychological impact of breaking such a widely-watched support level extends beyond just price action. It often leads to a shift in narrative and sentiment, with bearish interpretations gaining prominence in media coverage and social discourse. This feedback loop can accelerate selling as marginal holders capitulate and new buyers remain sidelined, awaiting lower prices. However, it’s worth noting that the most significant accumulation opportunities in cryptocurrency history have often emerged during these periods of maximum pessimism.
The Bull Case: Why Support Could Hold
Despite the bearish scenarios, compelling arguments exist for why the current Ethereum price level could represent a local bottom and a foundation for recovery. The first consideration is simple supply and demand dynamics. As mentioned earlier, the continued exodus of ETH from exchanges and increasing staking participation reduce available supply precisely when prices are depressed. This creates conditions where even modest demand increases can generate outsized price impacts.
From a valuation perspective, key metrics like the network value to transactions (NVT) ratio and price-to-sales equivalents suggest Ethereum may be undervalued relative to its fundamental usage and revenue generation. While valuation metrics in cryptocurrency remain imperfect, these indicators provide useful context for assessing whether current prices reflect reasonable assessments of Ethereum’s economic activity and utility.
The development activity within the Ethereum ecosystem continues unabated despite price weakness. Layer-2 solutions are scaling throughput exponentially, user experience improvements are being implemented through account abstraction and other innovations, and institutional adoption continues to progress. This sustained development activity supports the thesis that current prices may not reflect Ethereum’s long-term trajectory, creating asymmetric risk-reward for buyers at these levels.
Strategic Considerations for Traders and Investors

Navigating the current environment requires clear thinking about personal risk tolerance, time horizons, and investment objectives. For short-term traders, the current ETH support test presents both opportunity and danger. Those with the skill and risk appetite to trade bounces from support may find favorable risk-reward setups, but tight stop-losses become essential given the possibility of breakdown. Momentum traders might prefer waiting for a clear resolution—either a decisive bounce or confirmed break—before committing capital.
Long-term investors face a different calculus. If one’s conviction in Ethereum’s fundamental value proposition and long-term potential remains intact, periods of price weakness represent accumulation opportunities rather than exit signals. Dollar-cost averaging strategies can be particularly effective during these uncertain periods, allowing investors to build positions gradually without attempting to perfectly time the bottom. However, position sizing remains critical, as even well-researched investments can experience prolonged drawdowns.
Risk management cannot be overstated in the current environment. Setting clear invalidation levels, maintaining appropriate position sizes, and avoiding excessive leverage are fundamental principles that become especially important when assets test critical support. The difference between a manageable drawdown and catastrophic loss often comes down to these basic risk management practices.
Historical Context: Lessons from Previous Support Tests
Examining how Ethereum has behaved during previous support tests provides valuable context for the current situation. Throughout its history, ETH has experienced numerous moments when critical levels were tested, with varying outcomes that offer lessons for today’s market participants. During the 2018 bear market, Ethereum eventually broke through multiple support levels thought to be impregnable, ultimately declining over 90% from its peak before finding a sustainable bottom.
However, other instances show support levels holding against significant pressure and serving as launching pads for new bull phases. The March 2020 COVID-induced crash saw Ethereum briefly plunge to levels that had previously served as support, but the recovery was swift and powerful, with ETH ultimately reaching new all-time highs within a year. These divergent outcomes underscore that while technical levels matter, they’re not deterministic—market context, sentiment, and fundamental factors all play crucial roles.
What distinguished successful defenses of support from failures often came down to broader market conditions and the presence or absence of fundamental catalysts. When support tests coincided with positive fundamental developments—network upgrades, institutional adoption, regulatory clarity—bounces tended to be more sustainable. Conversely, when support tests occurred against backdrops of negative news flow and deteriorating fundamentals, breaks became more likely.
Scenarios and Probabilities
Looking forward, several scenarios could unfold from the current Ethereum market position. The bullish scenario involves support holding firmly, followed by a period of consolidation that absorbs selling pressure and allows momentum indicators to reset. This would be followed by a break above resistance levels, confirming that the correction has concluded and a new leg higher is beginning. This pathway would likely be accompanied by improving market sentiment, positive news catalysts, and technical breakouts in other major cryptocurrencies.
A neutral scenario might see Ethereum continue range-bound trading around current levels for an extended period, neither breaking support decisively nor generating enough momentum to clear overhead resistance. This sideways action would gradually compress volatility and could eventually lead to an explosive move in either direction, though predicting which way becomes difficult. Extended consolidation phases test investor patience but often precede the most significant directional moves.
The bearish scenario, as discussed earlier, involves a clean break of the support level with follow-through selling. This would likely lead to a testing of lower support zones and could extend the correction considerably. However, even in this scenario, the break could ultimately prove healthy by flushing out weak hands and creating the conditions for a more sustainable recovery from a lower base.
Conclusion
Ethereum stands at a critical inflection point, testing a support level that carries enormous technical and psychological significance. The convergence of multiple factors—technical indicators, on-chain metrics, macroeconomic conditions, and fundamental developments—makes this moment particularly consequential for the world’s leading smart contract platform. While uncertainty abounds and risks remain elevated, the current juncture presents both dangers to navigate and potentially significant opportunities for those positioned appropriately.
Whether this support level holds or breaks will likely determine Ethereum’s trajectory for months to come, influencing not just ETH itself but broader cryptocurrency market sentiment. The coming days and weeks will test the conviction of holders, the patience of buyers waiting for lower prices, and the resolve of bears convinced that further downside awaits. What remains clear is that Ethereum’s fundamental value proposition continues strengthening even as price struggles, creating the potential disconnect between current valuation and long-term potential that often defines generational investment opportunities.
For market participants, maintaining perspective, managing risk appropriately, and making decisions based on personal circumstances rather than short-term price action remains paramount. The current support test is just one chapter in Ethereum’s ongoing story—how it resolves will be significant, but won’t be the final word on this transformative technology’s ultimate impact and value.
FAQs
Q: What makes this particular Ethereum support level so important?
This support level represents a confluence of multiple technical factors,ors including the 200-week moving average, previous high-volume consolidation zones, and key Fibonacci retracement levels from recent rallies. Additionally, on-chain data reveals this price zone has historically seen significant accumulation, making it both a technical and fundamental point of interest. The psychological importance cannot be overstated—many traders and analysts have identified this level as a critical line in the sand, creating self-fulfilling dynamics where participants actively defend or attack it based on their market outlook.
Q: How can I tell if the support level has truly broken or if it’s just a temporary violation?
Determining whether a support break is genuine or merely a false breakdown requires examining multiple factors beyond just price. Look for sustained trading below the support level over multiple days, increasing volume on the breakdown, and follow-through selling that tests the next lower support zone. False breakdowns typically feature quick recoveries back above the broken level within hours or days, often on higher volume than the breakdown itself. Technical analysts often apply rules like requiring a close below support for multiple consecutive periods before considering it truly broken, reducing the likelihood of being fooled by temporary spikes.
Q: Should I buy Ethereum at current levels or wait for lower prices?
This decision depends entirely on your individual circumstances, risk tolerance, investment timeline, and conviction in Ethereum’s long-term prospects. If you believe in Ethereum’s fundamental value and are investing with a multi-year horizon, implementing a dollar-cost averaging strategy allows you to build positions gradually without trying to perfectly time the bottom. For those with lower risk tolerance or shorter timeframes, waiting for clearer technical confirmation of a bottom—such as higher lows and breaking above resistance—may be more appropriate. Never invest more than you can afford to lose, and ensure your Ethereum allocation fits within a diversified portfolio appropriate for your situation.
Q: What are the key indicators I should watch to anticipate Ethereum’s next major move?
Several indicators deserve attention for those monitoring Ethereum’s potential direction. On-chain metrics like exchange netflows, active addresses, and staking participation provide insights into actual network usage and holder behavior. Technical indicators, including RSI, MACD, and moving average relationships, help identify momentum shifts and potential reversal points. Additionally, monitoring Bitcoin’s price action is crucial since it often leads Ethereum and the broader crypto market. Correlation with traditional markets, particularly US equities, has increased in recent years and should be factored into analysis. Finally, keeping abreast of development milestones, regulatory news, and macroeconomic shifts provides essential context for price movements.
Q: How does Ethereum’s current situation compare to previous bear markets?
While every market cycle has unique characteristics, Ethereum’s current position shares some similarities with previous corrections while also exhibiting distinct differences. Like previous bear markets, we’re seeing reduced retail participation, declining transaction counts, and testing of long-term support levels. However, unlike past cycles, Ethereum now operates as a proof-of-stake network with deflationary tokenomics during high usage periods, substantial amounts of supply locked in staking, and significantly greater institutional participation.