Master Live Forex Charts: Real-Time Trading Analysis Made Simple
how live forex charts transform your trading decisions. Learn to read real-time data, spot trends, and maximize profits with professional chart analysis.
The foreign exchange market never sleeps, processing over $7.5 trillion in daily transactions across global time zones. For traders navigating this dynamic landscape, live forex charts serve as the essential compass, providing real-time market data that can make the difference between profitable trades and costly mistakes.
Whether you’re a seasoned professional or just beginning your forex journey, understanding how to effectively utilize live charts is crucial for making informed trading decisions. These powerful tools provide instantaneous price movements, technical indicators, and market sentiment data, enabling traders to identify opportunities and manage risk in the world’s most liquid financial market.
What Are Live Forex Charts?
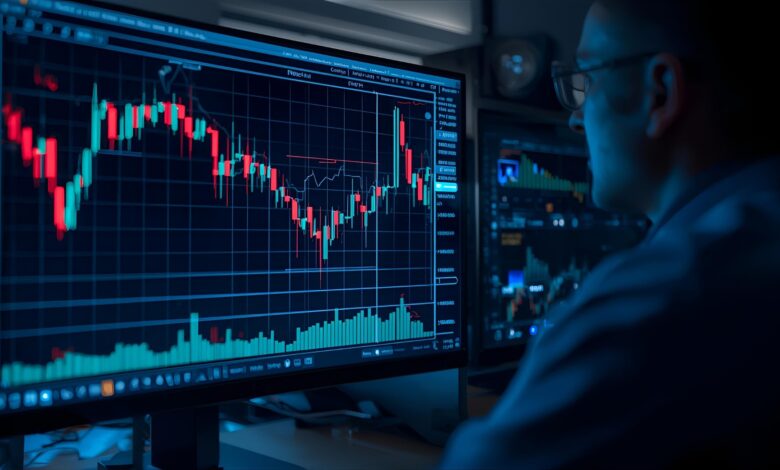
Live forex charts display real-time price movements of currency pairs, updating continuously as market conditions change. Unlike static charts that show historical data, these dynamic visualizations provide instant access to current market information, including bid and ask prices, trading volume, and price volatility.
These charts typically feature candlestick or line graphs that illustrate price action over various timeframes, from one-minute intervals to monthly periods. Professional traders rely on this immediate data feed to execute trades with precision timing and respond quickly to market fluctuations.
Key Components of Forex Charts
Modern live forex charts incorporate several essential elements that provide comprehensive market insights. Price data forms the foundation, showing opening, closing, high, and low values for each time period. Volume indicators reveal trading activity levels, while technical overlays like moving averages and trend lines help identify patterns.
Most platforms also integrate news feeds and economic calendar events directly into the chart interface, allowing traders to correlate price movements with fundamental market drivers. This integration creates a holistic trading environment where technical and fundamental analysis converge.
Essential Features to Look For
When selecting a live forex chart platform, several critical features distinguish professional-grade tools from basic offerings. Real-time data accuracy stands paramount, as even millisecond delays can impact trading outcomes in fast-moving markets.
| Feature | Importance | Description |
|---|---|---|
| Real-time Data Feed | Critical | Instant price updates with minimal latency |
| Multiple Timeframes | High | 1-minute to monthly chart intervals |
| Technical Indicators | High | 50+ built-in analysis tools |
| Drawing Tools | Medium | Trend lines, support/resistance levels |
| News Integration | Medium | Economic events and market announcements |
| Mobile Access | Medium | Cross-platform synchronization |
| Historical Data | Low | Extended price history for backtesting |
Advanced charting platforms also offer customizable interfaces, allowing traders to arrange multiple currency pairs simultaneously and create personalized layouts that match their trading strategies.
Top Platforms for Live Forex Charts
MetaTrader 4 and MetaTrader 5
MetaTrader platforms dominate the retail forex market, offering comprehensive charting capabilities with extensive customization options. Both versions provide real-time data feeds, advanced technical analysis tools, and automated trading functionality through Expert Advisors.
TradingView
TradingView has revolutionized online charting with its web-based platform that combines professional-grade analysis tools with social trading features. The platform offers free and premium tiers, with live data available for major currency pairs.
Professional Trading Platforms
Institutional-grade platforms, such as the Bloomberg Terminal and Reuters Eikon, offer unparalleled data quality and analysis depth, albeit at a substantial cost that makes them primarily suitable for professional traders and financial institutions.
Pros and Cons of Live Forex Charts

Pros
- Immediate Market Access: Instant price updates enable quick decision-making and opportunity identification
- Technical Analysis Power: Comprehensive indicator libraries support sophisticated trading strategies
- Risk Management: Real-time monitoring helps implement stop-losses and profit targets effectively
- Multi-Currency Monitoring: Track numerous pairs simultaneously for diversified trading approaches
- Historical Context: Access to extensive price history for pattern recognition and backtesting
Cons
- Information Overload: Excessive data streams can overwhelm novice traders and lead to analysis paralysis
- Subscription Costs: Premium platforms require ongoing monthly fees that can impact trading profitability
- Technology Dependence: Internet connectivity issues or platform outages can disrupt trading activities
- False Signals: Market noise and temporary price spikes may trigger incorrect trading decisions
- Emotional Trading: Constant price monitoring can encourage impulsive trades based on short-term fluctuations
Step-by-Step Method to Use Live Forex Charts Effectively
- Choose Your Primary Currency Pairs: Start with major pairs like EUR/USD, GBP/USD, or USD/JPY that offer tight spreads and high liquidity.
- Select Appropriate Timeframes: Match your chart timeframe to your trading style – scalpers use 1-5 minute charts, day traders prefer 15-minute to 4-hour intervals, and swing traders focus on daily charts.
- Configure Essential Indicators: Add moving averages, RSI, and MACD to identify trends and momentum shifts without cluttering your chart interface.
- Set Up Multiple Chart Layouts: Create workspace templates that display your preferred currency pairs and timeframes for quick access during trading sessions.
- Establish Price Alerts: Configure notifications for key price levels, technical indicator signals, or news events that could impact your positions.
- Practice with Demo Accounts: Use paper trading to test your chart reading skills and strategy effectiveness before risking real capital.
- Maintain Trading Journal: Document your chart-based decisions and outcomes to identify successful patterns and areas for improvement.
Advanced Chart Analysis Techniques
Professional traders employ sophisticated analysis methods that go beyond basic technical indicators. Multi-timeframe analysis involves examining the same currency pair across different time periods to confirm trend direction and identify optimal entry points.
Volume profile analysis reveals price levels where significant trading activity occurred, highlighting potential support and resistance zones. Market structure analysis focuses on higher highs, higher lows, and trend breaks to understand overall market direction and momentum shifts.
Correlation analysis between different currency pairs helps traders understand how various positions within their portfolio might interact, enabling better risk management and informed position sizing decisions.
Risk Management with Live Charts
Effective risk management requires constant market monitoring through live charts. Professional traders use real-time data to implement dynamic stop-losses that adjust with market volatility and protect against adverse price movements.
Position sizing calculations benefit from current volatility readings available through live charts. Average True Range (ATR) indicators help determine appropriate risk levels based on recent price movement patterns, ensuring consistent risk exposure across different market conditions.
See More: Bitcoin Technical Analysis Training Program Master Crypto Trading in 2025
Conclusion
Live forex charts represent an indispensable tool for successful currency trading, providing the real-time market intelligence necessary to navigate today’s complex financial markets. These powerful platforms combine instant price data with sophisticated analysis capabilities, enabling traders to identify opportunities, manage risk, and execute strategies with professional precision.
The key to maximizing the effectiveness of live charts lies in selecting the right platform for your trading style, mastering essential analysis techniques, and maintaining disciplined risk management practices. While the learning curve may seem steep initially, consistent practice and focus on practical application will develop the skills necessary for long-term trading success.
Remember that live forex charts serve as decision-support tools rather than crystal balls. Successful traders combine chart analysis with fundamental research, risk management principles, and emotional discipline to achieve consistent profitability in the dynamic world of currency trading.
FAQs
Q: Are free live forex charts accurate enough for serious trading?
A: Free charts from reputable sources like TradingView or broker platforms provide sufficient accuracy for retail trading. However, professional traders often invest in premium data feeds for reduced latency and additional features.
Q: What timeframe should beginners use for live forex charts?
A: New traders should start with 4-hour and daily charts to avoid market noise and develop pattern recognition skills. These timeframes provide clearer trend signals and reduce emotional trading pressure.
Q: How much historical data do I need on my live forex charts?
A: Most trading strategies require 200-500 candlesticks of historical data for proper context. This typically means 2-3 months of daily data or several weeks for intraday timeframes.
Q: Can I rely solely on live charts for trading decisions?
A: While charts provide valuable technical insights, successful traders combine chart analysis with fundamental research, economic calendars, and proper risk management for comprehensive decision-making.
Q: Do live forex charts work the same way during major news events?
A: Charts remain functional during news releases, but price volatility increases dramatically. Many traders avoid trading during high-impact news or use wider stop-losses to account for increased market movement.
Q: What’s the difference between live and delayed forex charts?
A: Live charts update in real-time with current market prices, while delayed charts show prices from 15-20 minutes ago. For active trading, real-time data is essential for accurate entry and exit timing.