BTC price outlook Is $108K the next big target?
BTC price eyes a $108K “ping pong” move. Here are 5 things Bitcoin traders should watch this week: macro cues, ETFs, on-chain data, liquidity, and risk.

The BTC price narrative rarely remains still, and this week it feels like the market is gearing up for another outsized move. Traders keep asking whether Bitcoin is coiling for a decisive breakout or a deeper retest, and the answer may be “both”—a classic “ping pong” range that can slingshot price toward six figures before snapping back to reload. With liquidity patchy and macro uncertainty simmering, the setup is ripe for volatility that punishes late entries and rewards patient planning.
In this deep dive, we’ll unpack five forces that could guide the Bitcoin price over the coming days: macro catalysts, ETF flows and derivatives structure, on-chain signals, liquidity and order book dynamics, and cycle context. Along the way, we’ll highlight practical levels, scenarios, and narratives to watch. The goal is not to predict every tick, but to map the probabilities and pathways that can keep you on the right side of the tape.
By the end, you’ll understand why a $108,000 magnet—however audacious it sounds—can emerge organically from positioning, on-chain metrics, and a maturing crypto market structure. Think of it less as a single call and more as a framework for trading a market that moves in surges, digests those moves, and then surges again.
Why “ping pong” matters: Bitcoin’s range logic
Before zooming in on this week’s catalysts, it helps to define the “ping pong” metaphor. In trending markets, Bitcoin often oscillates between liquidity pockets, sweeping highs and lows as it hunts stops. When ranges persist, a push to the upper boundary can invite momentum buyers, only for the price to snap back to the midpoint or lower bound. The process repeats until a decisive break in supply or demand is reached.
For BTC price outlook watchers, this means that range edges are rarely quiet. If order books are thin above prior swing highs, a breakout can travel faster than expected, drawing in FOMO bids that propel the price farther than “fair value” in the short run. A target like $108K may be the next high-liquidity shelf on the path of least resistance, not a mystical number. Conversely, failing to hold mid-range support can invite a swift return to previously reclaimed levels, rebalancing the market structure.
Macro week ahead: the data that can jolt crypto risk
The first driver to watch is the macro calendar. While Bitcoin has its own heartbeat, it is undeniably tethered to global liquidity conditions, U.S. yields, and the dollar index (DXY). Hotter-than-expected inflation data or a hawkish tone from policymakers tends to lift real yields and strengthen the dollar—two factors that can be headwinds for risk assets, including cryptocurrencies. Softer prints and dovish hints, by contrast, tend to favor risk appetite.
Going into this week, traders should monitor whether equities remain resilient and whether bond volatility subsides. If Treasury yields cool and DXY stalls under resistance, that opens the door for BTC to challenge overhead supply zones. A macro “green light” rarely guarantees upside, but it lowers friction for trend extension. Add in stable energy prices and benign credit spreads, and dip buyers gain confidence that any shakeouts are likely to be retracements, not trend reversals.
From a tactical standpoint, remember that macro reactions are often two-stage. The knee-jerk, headline-driven move may reverse within hours as desks digest the details. Traders who wait for the second impulse—once the dust settles—often find cleaner entries with tighter invalidations.
ETF flows and derivatives: a push-pull engine for BTC price
The next pillar involves identifying Bitcoin ETF flows and analyzing the structure of futures and options. Persistent net inflows into spot ETFs can create a steady bid that absorbs supply, especially when miners or long-term holders aren’t distributing aggressively. The inverse is also true: outflows or muted demand give sellers room to increase their prices.
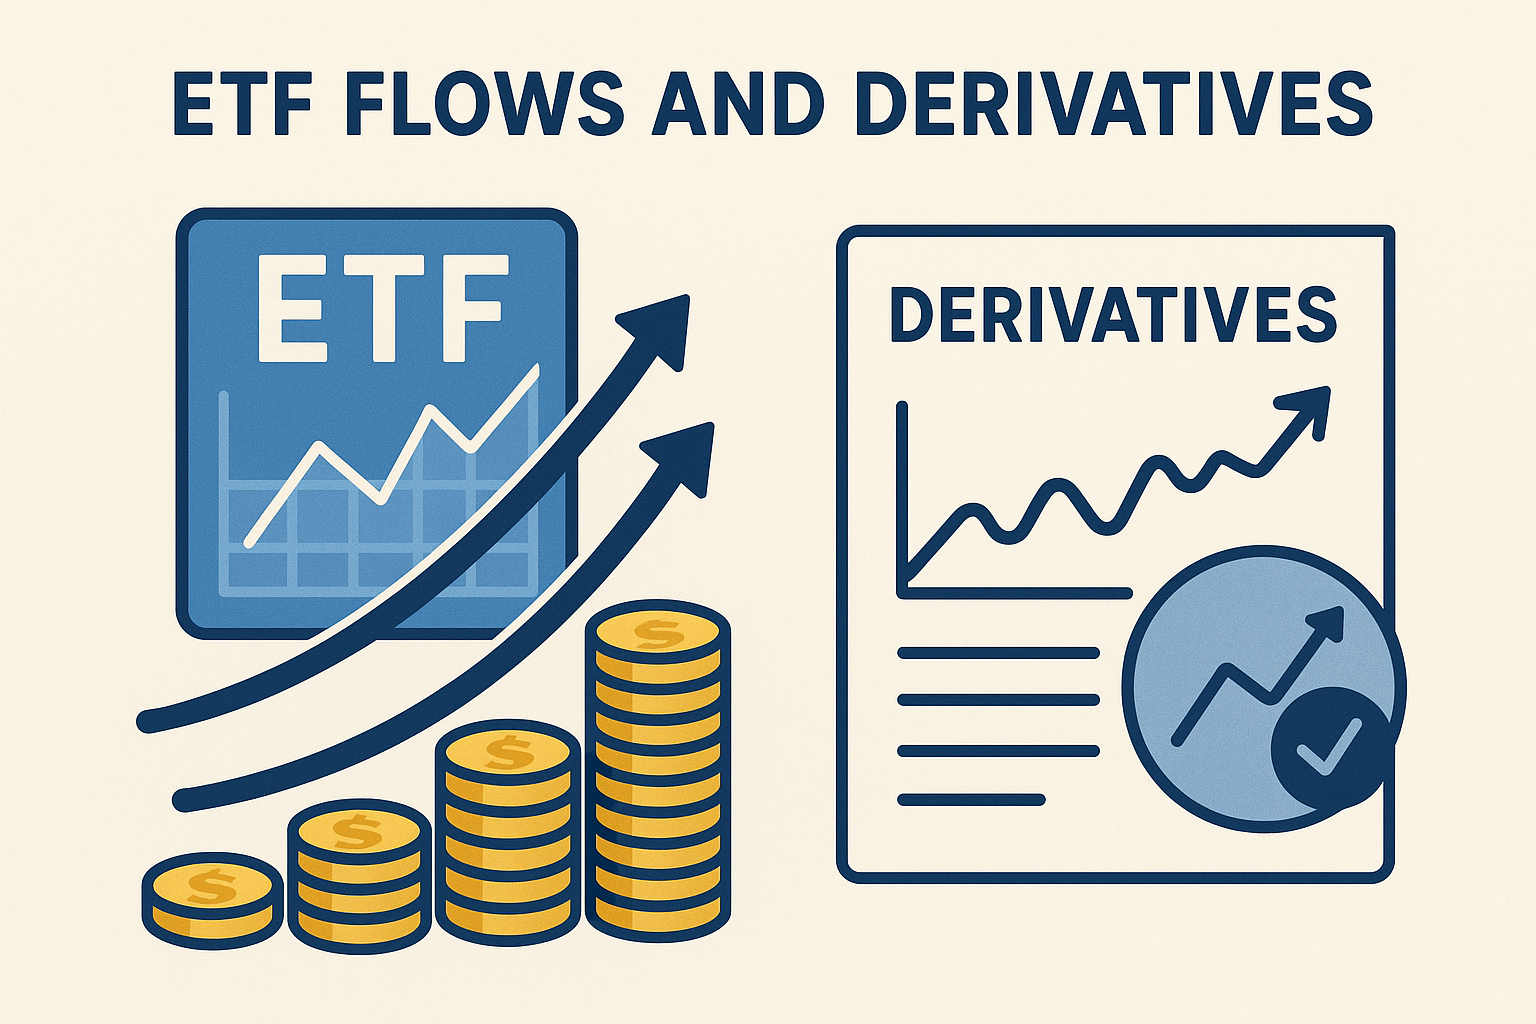
The futures basis—the gap between futures and spot—reveals whether traders pay a premium to leverage long positions. A sustained high basis can signal overheating, while a depressed or flat basis hints at caution. Options, for their part, reflect expectations via implied volatility (IV) and skew. When call demand outruns puts, dealers may need to hedge by buying spot or futures on upside moves, adding fuel. When demand is put, hedging can pressure the downside.
Put those pieces together and you can see the path to a $108K “ping pong” tag: if ETF inflows nudge spot higher while options dealers chase gamma into a breakout, the move can extend quickly. If, after tagging that high-liquidity area, flows fade and IV mean-reverts, the price can slide back toward reclaimed levels to reset funding and sentiment. This is how an ostensibly “wild” target emerges from the math of hedging and positioning.
Importantly, traders should note open interest density around round numbers. Psychological levels, such as $100K, often host clusters of stops, take-profits, and structured products. Once price slices into that zone, slippage can get dramatic, and the next shelf—say $108K—naturally becomes the magnet where engines cool down.
On-chain trends: the quiet story in the data
No discussion of Bitcoin price prediction would be complete without on-chain analytics. While no single metric is a crystal ball, a confluence of signals can upgrade or downgrade conviction. Watch these themes:
Long-term holder behavior and realized thresholds
When long-term holders (LTHs) distribute modestly into strength but do not capitulate, it signals orderly rotation rather than top formation. Compare spot prices to realized prices cohorts to see if newer buyers are underwater (under pressure) or in profit (cushioned). If the spot is comfortably above the aggregated cost basis of large cohorts, pullbacks often find responsive demand.
Exchange balances and liquidity migration
Declining exchange reserves suggest that coins are being moved to cold storage and custodians, often aligning with accumulation. Rising reserves can precede increased sell pressure. Also monitor stablecoin flows; net issuance and exchange deposits can front-run buying power.
Miner activity and fee pressure
Miners juggle hashrate, energy costs, and treasuries. Elevated fees or a hashrate plateau can nudge miners to sell into rallies to cover operations. If miner distribution remains subdued during upside, it lowers headwinds into significant resistance—and vice versa.
Combine these threads and you get a nuanced lens: if LTHs are steady, exchange balances trend down, and stablecoin float grows, then upside excursions—even to aggressive targets—become more plausible. A week that confirms those conditions strengthens the case for a liquidity hunt into the low six figures.
Liquidity, order books, and the path of least resistance
Order book liquidity maps often look like Swiss cheese near inflection points. Thick bids may sit just below obvious supports, while ask walls cluster above prior highs. The bigger question is which side is real and which side is spoofed. In crypto, the shown size can disappear on impact, so the more reliable guide is where stops and liquidations will cascade.
If perpetual funding remains tame and leverage is not excessive, a squeeze can travel far before cooling. That’s how a breakout can overshoot to $108K—not because every participant believes that number is fair value, but because thin books plus forced flows have a habit of overshooting. After the sweep, the market often “checks back” to the breakout zone, shaking out late longs and testing whether prior resistance has turned into support.
For traders, mapping liquidity voids is a practical approach to managing risk. Identify the last major weekly lower high or the first weekly consolidation above the breakout. Those pockets tend to act as re-entry or partial-take-profit zones. If price revisits them on declining volume and holds, the trend remains intact. If it cuts through swiftly, the ping-pong table just expanded.
Cycle context: halving math, adoption, and reflexivity
Zooming out, Bitcoin’s halving cycle rhythm still matters. Reduced issuance doesn’t mechanically pump price, but it tilts the supply curve just as each cycle’s demand story—institutional adoption, ETF access, global liquidity—changes the demand curve. The intersection of tighter supply and broader access fuels reflexivity: rising prices attract attention, which in turn spurs new inflows, pushing prices higher.
In prior cycles, Bitcoin didn’t move in straight lines. It advanced in impulse waves, then retraced to fib or structural levels, often building higher lows before the next leg. A “ping pong” week inside that framework is not noise; it’s the engine room where the next leg is forged. If the current cycle continues to deliver ETF adoption, corporate treasury interest, and improvements in custody and compliance, then an overshoot to $108K during a trend continuation is neither outrageous nor guaranteed—it’s the kind of fat-tailed event a prudent trader plans for.
Key levels and scenarios for the week
Price action ultimately boils down to levels and the behavior surrounding them. If Bitcoin pushes through the prior range high on expanding volume and rising open interest—without funding going parabolic—that’s constructive. The first check is whether pullbacks find higher-timeframe support at the breakout shelf. Hold there, and the path toward round-number gravity strengthens.
Failing that, acceptance back inside the range suggests a deviation and invites the other edge. In that scenario, watching for a higher low in the daily structure becomes critical. Reclaim that level with conviction, and the bulls can reload; lose it, and deeper tests beckon.
The “ping pong” idea, then, is not a promise of chaos. It is a reminder that breakouts and retests are two halves of the same move. Strong trends breathe, and the best trades often come after the exhale.
Risk management in a six-figure world
Discussing $108K can make eyes glaze over or hands tremble. Neither response helps. What matters is the risk definition. Decide where your idea is wrong and size so you can survive being wrong several times. If you’re a spot holder, pre-commit to profit-taking bands so you don’t panic-sell the first red candle. If you’re a trader, align your exposures with volatility regimes. When realized volatility expands, tighten your leash and let the price come to you.
Above all, avoid over-optimization and the illusion of perfect precision. Markets reward those who manage uncertainty effectively, not those who demand certainty before taking action.
Narrative watch: what could accelerate or derail the move
Two positive narratives can accelerate upside. First, a surprise uptick in ETF inflows after a quiet period can quickly shift sentiment, especially if accompanied by declining exchange reserves. Second, a macro relief rally sparked by softer inflation or dovish rhetoric can prompt systematic allocators to re-enter crypto risk, thereby increasing BTC dominance and subsequently the broader altcoin market.
On the flip side, a sudden liquidity shock—from a regulatory headline, a major exchange outage, or a sharp risk-off day in equities—can yank the rug. In such moments, watch funding, basis, and options IV. If IV spikes and skew flips toward puts, protocols of defense beat hopes for immediate reversal. The healthier the uptrend, the faster it should repair once the shock passes. Weak trends don’t repair; they meander.
Strategy notes for different profiles
If you’re a long-term participant, your focus is structural uptrends and prudent rebalancing. You can use “ping pong” weeks to trim into strength near obvious liquidity shelves and to add selectively on higher-low retests. If you’re an active trader, the edge is in recognizing when a breakout is likely to sustain versus deviate, and in entering where your invalidations are crisp.
Either way, keep an eye on market breadth, stablecoin supply, and cross-asset correlations. Improving breadth and expanding stablecoin float support the case for sustained risk-taking. Tightening correlations to equities can be both a blessing (on risk-on days) and a curse (on risk-off days). Context is king.
Conclusion
Bitcoin thrives on motion. When ranges compress and narratives stack, BTC price outlook can burst through ceilings and then ricochet as the market rebalances. A $108K print is not prophecy; it’s a plausible waypoint on a path defined by liquidity, flows, and behavior. If you approach this week with a clear map—macro cues, ETF and derivatives structure, on-chain trends, liquidity contours, and cycle context—you won’t need to guess. You’ll respond.
In that sense, the “ping pong” is your friend. It creates opportunity for those who can plan entries and exits, respect invalidations, and avoid chasing. Keep your thesis flexible, your risk defined, and your expectations grounded. The rest is tape-reading—and the tape is getting louder.
FAQs
Q: What does a “ping pong” move mean for the BTC price?
A “ping pong” move describes Bitcoin oscillating between liquidity pockets within a range, sweeping highs and lows to trigger stops before settling. In practice, this means breakouts can overshoot into thin order books—at times, toward targets like $ 108,000—and then snap back to retest breakout zones. Traders should anticipate both the expansion and the check-back rather than betting on a one-way sprint.
Q: How important are spot Bitcoin ETF flows right now?
Spot ETF inflows act like a steady vacuum, drawing in supply. Persistent net inflows support trend continuation, while outflows or stagnation remove a key tailwind. Combined with options dealer hedging, strong inflows can amplify upside. However, flows are one input; they work best alongside supportive macro, healthy on-chain conditions, and manageable leverage.
Q: Which on-chain metrics best signal sustainable upside?
No single metric is decisive, but a constructive mix includes stable or rising long-term holder supply, declining exchange balances, growing stablecoin float, and miners distributing only modestly. When these align and spot reclaims prior highs, follow-through has historically improved, making upper liquidity shelves more attainable.
Q: How can I manage risk if BTC spikes toward $108K?
Define invalidations in advance and size so you can withstand volatility. If you’re spot-heavy, pre-plan profit-taking bands near round numbers and prior weekly trend lines. If you trade derivatives, watch funding, basis, and IV for signs of overheating. A spike into $108K is often followed by a check-back—having a plan for both legs is essential.
Q: Is $ 108,000 a fair value for Bitcoin, or just a liquidity target?
In the short term, it’s closer to a liquidity target than a valuation anchor. The fair value of Bitcoin is uncertain and evolves with adoption, macroeconomic liquidity, and market cycle dynamics. A level like $108K is where stops, orders, and dealer hedging can cluster, making it a magnet during expansion. Whether it holds or fades depends on how demand behaves after the sweep.
See More: Bitcoin Price Crash: Why Bitcoin Is Not Done Yet at $112,000