How to Read Forex Charts: Your Complete Guide to Currency Trading Success

Understanding how to read forex charts is the foundation of successful currency trading. Whether you’re a complete beginner or looking to refine your skills, mastering chart analysis can dramatically improve your trading decisions and profitability.
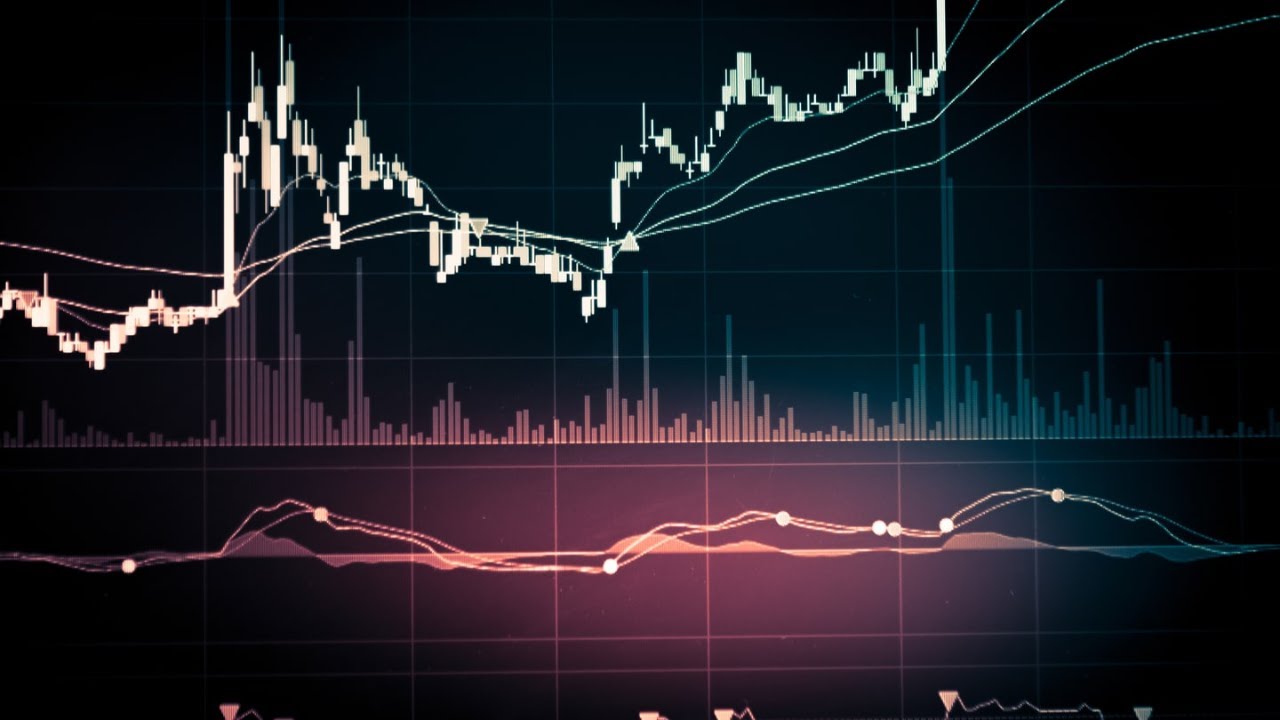
Forex charts display the price movements of currency pairs over time, revealing crucial information about market sentiment, trends, and potential trading opportunities. Learning to interpret these visual representations of market data is essential for anyone serious about foreign exchange trading.
The ability to read forex charts effectively separates profitable traders from those who struggle. By the end of this comprehensive guide, you’ll have the knowledge and confidence to analyse currency movements, identify trading patterns, and make informed decisions in the dynamic forex market.
What Are Forex Charts and Why Do They Matter
Forex charts are graphical representations of currency pair price movements over specific periods. These visual tools display how exchange rates fluctuate, helping traders identify patterns, trends, and potential entry or exit points for their trades.
Every successful forex trader relies on chart analysis to make informed decisions. Charts eliminate guesswork by providing concrete visual data about market behaviour, allowing you to spot opportunities that might otherwise go unnoticed.
The foreign exchange market operates 24 hours a day, five days a week, generating massive amounts of price data. Charts organise this information into digestible formats, making it possible to analyse market movements efficiently and effectively.
Essential Types of Forex Charts You Must Know

Line Charts: The Simplest Starting Point
Line charts connect closing prices over time, creating a smooth line that shows the general direction of a currency pair. While basic, they’re excellent for identifying long-term trends and overall market sentiment.
These charts are ideal for beginners who want to understand price direction without being overwhelmed by detailed information. They offer a clear and uncluttered view of market movements.
Bar Charts: More Detailed Price Information
Bar charts display four crucial price points for each period: open, high, low, and close (OHLC). Each vertical bar represents these values, providing more comprehensive market information than line charts.
The top of each bar shows the highest price reached during that period, while the bottom indicates the lowest price. Small horizontal lines on the left and right represent opening and closing prices, respectively.
Candlestick Charts: The Trader’s Favourite
Candlestick charts present the same OHLC information as bar charts but in a more visually appealing and informative format. Each “candle” has a body (representing the range between open and close) and wicks or shadows (showing the high and low).
Green or white candles typically indicate bullish periods where the closing price exceeded the opening price. Red or black candles show bearish periods where prices closed lower than they opened.
How to Read Forex Charts: Step-by-Step Analysis
Understanding Time Frames
Forex charts can display data across various time frames, from one-minute intervals to monthly periods. Short-term traders often focus on 5-minute, 15-minute, or hourly charts, while long-term investors prefer daily, weekly, or monthly views.
Choosing the right time frame depends on your trading strategy and goals. Day traders need shorter time frames for quick decisions, while swing traders might analyse daily or weekly charts for broader market perspectives.
Identifying Trends and Market Direction
Successful chart reading begins with trend identification. Uptrends show higher highs and higher lows, while downtrends display lower highs and lower lows. Sideways trends indicate consolidation periods, during which prices move within a specific range.
Drawing trend lines connecting significant highs or lows helps visualise market direction. These lines often act as support or resistance levels, providing valuable insights for future price movements.
Recognising Support and Resistance Levels
Support levels represent price points where buying pressure typically emerges, preventing further price declines. Resistance levels indicate areas where selling pressure often appears, limiting upward price movement.
These levels often coincide with previous highs, lows, or significant psychological price points. Identifying strong support and resistance zones enables traders to make more informed entry and exit decisions.
Key Technical Indicators for Forex Chart Analysis
Moving Averages: Smoothing Price Action
Moving averages calculate average prices over specific periods, creating smooth lines that help identify trends and potential reversal points. Simple moving averages (SMA) and exponential moving averages (EMA) are most commonly used.
When prices trade above moving averages, it often indicates bullish momentum. Conversely, prices below moving averages suggest bearish sentiment. Crossovers between different moving average periods can signal changes in trend.
Relative Strength Index (RSI): Measuring Momentum
The RSI oscillates between 0 and 100, helping traders identify overbought and oversold conditions. Values above 70 typically suggest overbought markets, while readings below 30 indicate oversold conditions.
RSI divergences, where price moves in one direction while the indicator moves in the opposite direction, often signal potential trend reversals. This makes RSI valuable for timing entry and exit points.
MACD: Trend Following and Momentum
The Moving Average Convergence Divergence (MACD) combines trend-following and momentum indicators. It consists of the MACD line, signal line, and histogram, providing multiple signals for trade opportunities.
MACD crossovers, where the MACD line crosses above or below the signal line, generate buy and sell signals. The histogram illustrates the difference between these lines, indicating the strength of momentum.
For comprehensive technical analysis education, consider exploring resources from Investopedia’s technical analysis section, which offers detailed explanations of various indicators and chart patterns.
Common Chart Patterns Every Trader Should Recognise

Reversal Patterns
Head and shoulders, double tops, and double bottoms are classic reversal patterns that signal potential trend changes. These formations often appear at market turning points, providing early warning signals for strategic adjustments to position.
Recognition of these patterns requires practice and patience, as false signals can occur in volatile markets. Confirmation through volume analysis and additional indicators improves pattern reliability.
Continuation Patterns
Triangles, flags, and pennants typically indicate temporary pauses in existing trends rather than complete reversals. These patterns suggest that current trends will likely resume after brief periods of consolidation.
Understanding continuation patterns helps traders avoid premature exits from profitable positions and identify optimal entry points for trend-following strategies.
Also Read: How to Read Forex Charts Like a Pro
Practical Tips for Effective Forex Chart Reading
Start with Higher Time Frames
Begin your analysis with daily or weekly charts to understand the broader market context before examining shorter time frames. This top-down approach offers a more comprehensive view of the overall market direction and primary support and resistance levels.
Higher time frames filter out market noise and provide more reliable signals, making them ideal for developing a comprehensive trading plan.
Use Multiple Confirmation Signals
Never rely on a single indicator or pattern for trading decisions. Combine different analysis methods to increase the probability of successful trades. Look for convergence between price action, technical indicators, and fundamental factors.
This multi-layered approach reduces false signals and improves overall trading performance.
Practice with Demo Accounts
Before risking real money, practice chart reading skills using demo trading accounts. This allows you to experiment with different strategies and indicators without financial consequences.
For additional practice and learning resources, check out [forex chart reading tutorials] to enhance your analytical skills.
Advanced Chart Reading Strategies
Volume Analysis Integration
While forex markets don’t have centralised volume data like stock markets, tick volume and volume indicators can still provide valuable insights. High volume often confirms price movements, while low volume might indicate weak trends.
Combining volume analysis with price action helps validate trading signals and identify potential breakout opportunities.
Multiple Time Frame Analysis
Professional traders analyse multiple time frames simultaneously to gain a comprehensive understanding of the market. This approach involves checking long-term trends on daily and weekly charts while identifying precise entry points on shorter time frames.
Multiple time frame analysis helps align trades with broader market trends while optimising entry and exit timing.
Conclusion
Mastering how to read forex charts is a journey that requires dedication, practice, and continuous learning. The skills you develop will serve as the foundation for all your future trading decisions and success in the foreign exchange market.
Remember that chart reading is both an art and a science. While technical indicators and patterns provide objective data, interpreting them requires experience and intuition that develops over time. Start with the basics, practice regularly, and gradually incorporate more advanced techniques.
Ready to put your newfound knowledge into practice? Begin by opening a demo trading account and start analysing real-time forex charts using the techniques outlined in this guide. The more you practice reading forex charts, the more confident and profitable your trading decisions will become.
Frequently Asked Questions
Q: How long does it take to learn how to read forex charts effectively?
A: Most beginners can grasp basic chart-reading concepts within 2-4 weeks of consistent study and practice. However, developing advanced analytical skills typically takes 3-6 months of regular market observation and demo trading.
Q: Which time frame is best for reading forex charts as a beginner?
A: Beginners should start with daily charts to understand overall market trends, then gradually incorporate 4-hour and 1-hour charts for more detailed analysis. Avoid very short time frames until you master longer-term chart reading.
Q: Can I trade successfully using only chart analysis, without relying on fundamental analysis?
A: While purely technical trading is possible, combining chart analysis with fundamental factors typically produces better results. Economic news and events can cause sudden price movements that technical analysis alone might not predict.
Q: What’s the most critical indicator for reading forex charts?
A: There’s no single “best” indicator, but moving averages are excellent starting points for beginners. They help identify trends and provide explicit visual references for market direction and potential support and resistance levels.
Q: How do I avoid false signals when reading forex charts?
A: Use multiple confirmation signals, avoid trading during low-volume periods, and always consider the broader market context. Additionally, wait for a clear pattern completion rather than jumping on partial formations.


