ETH Price Alert Can Bulls Defend $2,700 Support Level?
ETH Price Alert Can Bulls Defend Key support levels, price predictions, and whether ETH can avoid falling to $2,500 in November 2025.

Ethereum (ETH) is finding itself at a critical juncture as prices hover around the $2,700 mark. After experiencing significant downward pressure throughout November 2025, the second-largest cryptocurrency by market capitalization faces a crucial test that could determine whether buyers can defend current levels or if a further decline toward $2,500 becomes inevitable. ETH Price Alert Can Bulls Defend: This comprehensive analysis explores the current market dynamics, technical indicators, and factors influencing Ethereum’s short-term trajectory.
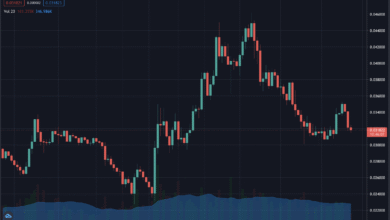
As of today, the live Ethereum price stands at approximately $2,715 with a 24-hour trading volume exceeding $29 billion, reflecting continued interest from traders despite the bearish sentiment. The cryptocurrency has experienced notable weakness compared to its recent highs, raising questions about whether accumulation zones will provide sufficient support or if additional downside awaits.
Current Ethereum Market Analysis: ETH Price Alert Can Bulls Defend
The recent Ethereum price action has been characterized by sustained selling pressure that has pushed ETH below several key psychological and technical levels. Ethereum is currently down by approximately 3% and trading below $2,800, struggling to regain the crucial $3,000 level with market pressure attributed to heavy selling and ETF outflows. This bearish momentum represents a significant shift from the optimistic projections that many analysts held for November 2025.
Understanding the context behind this decline requires examining both short-term catalysts and broader market dynamics. The cryptocurrency market as a whole has faced headwinds from macroeconomic uncertainty, particularly regarding Federal Reserve policy decisions and their impact on risk assets. When traditional financial markets experience volatility, digital assets like Ethereum often see amplified price movements as investors reassess their risk exposure.
The trading volume patterns reveal important insights about market conviction. While the 24-hour volume remains substantial, there has been a noticeable decrease in buying momentum at higher price levels. This volume profile suggests that sellers have been more aggressive than buyers in recent sessions, creating the downward pressure that has characterized Ethereum’s performance throughout November.
Critical Support Levels Can $2,700 Hold Against Selling Pressure

Technical analysis plays a crucial role in identifying where Ethereum might find buyers willing to defend current price levels. After breaching the key $2,800 support and dipping to $2,650, ETH must reclaim that level soon to avoid a potential decline toward $2,500, as analysts note this move historically increases the likelihood of another 5-10% downside unless the price reclaims lost territory quickly.
The current support structure reveals several key levels that traders are monitoring closely. The immediate support zone exists between $2,680 and $2,700, where some accumulation has been observed. Drawing from prior correction structures, several support zones continue to shape short-term sentiment, including $2,681 as a notable liquidity zone tested in past corrections, and $2,606 as a deeper support area aligned with current downward momentum.
Beyond these immediate levels, the $2,500 price point represents a psychologically significant support area that has historically attracted substantial buying interest. If Ethereum were to test this level, it would represent a decline of approximately 8-10% from current prices and would likely trigger increased volatility as both long-term holders and short-term traders reassess their positions.
The resistance levels above current prices are equally important for understanding potential recovery scenarios. The $2,800-$2,900 range has transformed from support into resistance, creating a barrier that bulls must overcome to establish renewed upward momentum. Successfully reclaiming these levels would be the first step toward invalidating the bearish thesis and potentially targeting the psychologically important $3,000 level.
Technical Indicators Signal Oversold Conditions: A Potential Turning Point?
When analyzing Ethereum’s current position, multiple technical indicators provide valuable insights into potential near-term price movements. The Relative Strength Index currently stands at 29.19, which indicates that the ETH market is in an oversold position, with the RSI indicator suggesting potential for price recovery. Oversold conditions often precede bounce attempts, though they don’t guarantee immediate reversal.
The Moving Average Convergence Divergence (MACD) indicator tells a complementary story. While still showing bearish momentum, the magnitude of negative readings suggests the selling pressure may be reaching exhaustion levels. Historical patterns indicate that when RSI reaches extreme oversold territory while price maintains above critical support levels, sharp relief rallies often follow.
Bollinger Bands analysis reveals that Ethereum is currently hugging the lower band, which typically indicates an extended move in one direction. Prices trading at the lower Bollinger Band often see mean reversion attempts toward the middle band, which currently sits around $3,229. This technical setup creates a favorable risk-reward scenario for traders looking for short-term bounce opportunities.
The convergence of multiple oversold indicators suggests that Ethereum may be approaching a near-term inflection point. However, oversold conditions can persist longer than many traders anticipate, especially during strong trending markets. The key will be watching for confirmation signals such as increasing volume on upward price movements and successful reclaiming of minor resistance levels.
Whale Activity and On-Chain Metrics: What Large Holders Are Doing
On-chain analysis provides crucial insights into the behavior of large Ethereum holders and can often signal future price movements before they become apparent through traditional technical analysis. On-chain data from Glassnode and IntoTheBlock shows that accumulation by large ETH holders slowed as prices dipped below $3,000, with addresses holding 1-10 million ETH reducing activity, confirming reduced confidence in short-term price strength.
This whale behavior represents a notable shift from earlier patterns observed throughout 2025. When large holders reduce their accumulation during price declines, it often indicates uncertainty about where the bottom might form. However, it’s important to note that whale positioning can change rapidly once clear support levels are established and tested successfully.
The MVRV (Market Value to Realized Value) ratio has also reached concerning levels. The MVRV long/short ratio recently touched a four-month low, indicating weakening profitability among long-term holders, a condition that often precedes either capitulation or fresh accumulation. This metric suggests that many holders are sitting on reduced profits or even losses at current prices, which can influence their decision-making regarding whether to hold or sell.
Exchange reserve data tells another important part of the story. When Ethereum moves off exchanges into private wallets, it typically indicates accumulation and reduced selling pressure. Conversely, increasing exchange reserves often precedes selling. Monitoring these flows provides early warnings about potential price movements and shifts in market sentiment.
ETF Flows and Institutional Interest: A Mixed Picture for Ethereum
The introduction of Ethereum ETFs has been one of the most significant developments for the ecosystem in 2025, providing institutional investors with regulated access to ETH exposure. Ethereum spot ETFs recorded $55.71 million net inflows on November 21, ending an eight-day outflow streak, with Fidelity’s FETH leading inflows. This development suggests that institutional interest hasn’t completely vanished despite the price weakness.
Understanding ETF flow patterns requires looking beyond single-day movements to identify broader trends. The eight-day outflow streak that preceded the recent inflow day reflects the risk-off sentiment that has characterized much of November. When institutional investors reduce exposure through ETF redemptions, it creates additional selling pressure on the underlying asset.
Early ETF flow data from CoinShares implies steady capital rotation into ETH-related products even during price drawdowns, with regulatory developments surrounding U.S. and Asian ETH ETF approvals continuing to shape expectations for 2026. This longer-term institutional interest provides a fundamental support mechanism that may help limit downside even if short-term weakness persists.
The relationship between ETF flows and Ethereum prices isn’t always immediately apparent. There can be lag effects where institutional positioning takes time to influence market prices, particularly during periods of high volatility. However, sustained positive flows generally provide underlying support that becomes more apparent over weeks and months rather than days.
Network Fundamentals and Upcoming Upgrades: The Fusaka Factor
Beyond price action, Ethereum’s fundamental developments continue to progress, potentially setting the stage for future appreciation regardless of near-term volatility. Ethereum’s Fusaka upgrade, scheduled for December 3, 2025, aims to double blob capacity from 6 to 14 blobs per block via PeerDAS, which could reduce Layer 2 fees by approximately 95% and enable 12,000+ transactions per second by 2026.
These technical improvements directly address one of the most common criticisms of Ethereum: transaction costs and scalability. By dramatically reducing fees for Layer 2 solutions, the Fusaka upgrade could accelerate adoption of Ethereum-based applications and increase network activity. Historical precedent suggests that major network upgrades often catalyze renewed interest and can influence price action.
The DeFi (Decentralized Finance) ecosystem built on Ethereum remains robust despite price volatility. Total value locked in Ethereum-based protocols continues to represent the majority of the entire DeFi sector, demonstrating the network’s continued dominance in this crucial use case. As long as developers and users continue choosing Ethereum for DeFi applications, the fundamental case for long-term value appreciation remains intact.
Staking dynamics also play an increasingly important role in Ethereum’s economic model. The Proof-of-Stake consensus mechanism means that ETH holders can earn yields by participating in network security. This staking yield effectively removes supply from circulation and provides an opportunity cost for selling, potentially supporting prices during periods of market weakness.
Price Predictions Expert Forecasts for Ethereum’s Near-Term Trajectory

When examining price predictions from various analysts and platforms, a wide range of scenarios emerges for Ethereum’s near-term prospects. Price prediction experts suggest that Ethereum is likely to continue bearish momentum for the short term, with traders advised to expect a price correction below $2,500 by the end of November 2025. This bearish outlook reflects the technical damage done by recent selling and the need for consolidation before a sustainable recovery can begin.
However, not all analysts share this pessimistic view. Some technical analysts point to the oversold conditions and historical support levels as reasons for optimism. The consensus range of $2,920-$3,170 provides a realistic framework for ETH price prediction over the next week, with CoinCodex projecting $3,169.57 within five days, representing a potential 15.5% gain from current levels. These more optimistic projections rely on the assumption that oversold conditions will trigger buying interest and spark a relief rally.
The divergence in predictions highlights the uncertainty inherent in cryptocurrency markets, particularly during periods of high volatility. Traders and investors should consider multiple scenarios when planning their strategies, recognizing that both upside surprises and downside continuation remain possible outcomes.
Looking further out, medium-term forecasts remain generally constructive on Ethereum’s prospects. The price prediction for Ethereum indicates a 7% rise by the end of November 2025, with ETH likely to reach $3,870, with increasing DeFi usage, staking demand, and positive investor sentiment expected to be main factors keeping the price stable. These projections assume that the current weakness represents a healthy correction within an ongoing bull market rather than the beginning of a more sustained downturn.
Market Sentiment and Fear & Greed Index: Gauging Investor Psychology
Understanding market sentiment provides crucial context for interpreting price movements and anticipating potential reversals. The Fear & Greed Index is currently showing 14, indicating Extreme Fear conditions. Extreme Fear readings often coincide with local price bottoms, as excessive pessimism creates opportunities for contrarian buyers to accumulate at attractive valuations.
The sentiment indicators reflect the psychological toll that the November decline has taken on market participants. When prices fall sharply, fear often becomes self-reinforcing as investors worry about further declines and rush to exit positions. However, experienced traders recognize that maximum pessimism often coincides with maximum opportunity.
Social media sentiment and search trends also provide insights into retail investor interest. Declining search volume for Ethereum-related terms during price weakness typically indicates that retail investors have lost interest, which paradoxically can signal that a bottom is forming. When the general public stops paying attention to an asset, it often means that weak hands have already sold and firmer holders remain.
The sentiment cycle in cryptocurrency markets tends to follow predictable patterns, swinging from extreme greed during rallies to extreme fear during corrections. Recognizing where the market sits within this cycle helps frame expectations and identify potential turning points. Current extreme fear readings suggest the market may be closer to a local bottom than a continuation of the decline, though confirmation through price action is still required.
Bitcoin’s Influence on Ethereum: Correlation Dynamics
The relationship between Bitcoin and Ethereum prices remains a crucial factor influencing ETH’s trajectory. The Ethereum price is slightly red near $3,013, down about 1.8%, while Bitcoin stays marginally green, with the underperformance not new. This pattern of Ethereum underperforming Bitcoin has characterized much of the recent period and raises questions about altcoin strength relative to the crypto market leader.
When Bitcoin experiences significant price movements, Ethereum and other altcoins typically follow with amplified volatility. If Bitcoin were to break down below key support levels, it would likely trigger accelerated selling in Ethereum and the broader altcoin market. Conversely, a Bitcoin rally could provide the catalyst needed for Ethereum to reclaim lost ground and challenge overhead resistance.
The correlation dynamics between major cryptocurrencies have important implications for portfolio construction and risk management. During risk-off periods, correlations tend to increase as all crypto assets move together. This means that diversification within cryptocurrency provides less protection during market stress than many investors expect.
Understanding Bitcoin’s technical position, therefore, becomes essential for Ethereum traders. Monitoring key Bitcoin support and resistance levels, along with its own sentiment indicators, provides early warning signals about potential moves in the broader crypto market that will inevitably impact Ethereum prices.
Trading Strategies: How Investors Should Navigate Current Conditions
Given the uncertain outlook and multiple competing scenarios, developing appropriate trading strategies becomes crucial for both short-term traders and long-term investors. For those with short-term horizons, the oversold technical conditions suggest potential for tactical bounce attempts, though strict risk management becomes essential given the bearish momentum.
Traders considering long positions at current levels should implement clear stop-loss orders below key support zones. The critical support level sits at $2,623, and a breakdown below this point would target the next major support around $2,400-$2,500, representing an additional 12-15% decline. Position sizing should reflect this downside risk, with traders only allocating capital they can afford to lose if the bearish scenario plays out.
For long-term investors focused on multi-month or multi-year horizons, current weakness may represent accumulation opportunities. Dollar-cost averaging strategies allow investors to build positions gradually during volatile periods without trying to perfectly time the bottom. This approach reduces the risk of investing too early while still capturing exposure to potential future upside.
Risk management extends beyond just position sizing and stop losses. Diversification across different assets, maintaining adequate cash reserves, and clearly defining investment objectives all contribute to navigating volatile markets successfully. Understanding personal risk tolerance and avoiding emotional decision-making becomes especially important during periods of high volatility like the present.
Regulatory Environment and Its Impact on Ethereum Prices
The regulatory landscape for cryptocurrencies continues evolving, with potential implications for Ethereum’s price trajectory. The SEC is reviewing proposals, including BlackRock’s ETH,A to allow staking in Ethereum ETFs, with approval potentially unlocking $15 billion or more in inflows, though the process faces regulatory hurdles around yield classification. Positive regulatory developments could serve as catalysts for renewed investor interest.
Regulatory clarity generally benefits established cryptocurrencies like Ethereum by removing uncertainty that prevents institutional participation. As major financial institutions develop more confidence in the legal framework surrounding digital assets, capital flows into the space tend to increase. This dynamic played out significantly in 2025 with the approval of spot Ethereum ETFs.
However, regulatory risk remains a two-sided coin. Negative developments, such as stricter restrictions on cryptocurrency activities or unfavorable tax treatment, could dampen enthusiasm and create selling pressure. Monitoring regulatory news and understanding how different jurisdictions approach cryptocurrency regulation provides important context for assessing Ethereum’s prospects.
The global nature of cryptocurrency regulation adds complexity, as developments in any major market can influence prices. Positive news from one jurisdiction might offset concerns elsewhere, creating a complex mosaic of regulatory influences that traders must navigate when making investment decisions.
Solutions and Ethereum’s Scalability Roadmap
The growth of Layer 2 scaling solutions represents a crucial element in Ethereum’s long-term value proposition. These protocols, including Arbitrum, Optimism, Polygon, and others, process transactions off the main Ethereum blockchain before settling final results back to the base layer. This architecture dramatically increases throughput while maintaining Ethereum’s security guarantees.
The upcoming Fusaka upgrade specifically targets improvements for Layer 2 solutions by increasing data availability through blob space expansion. By making Layer 2 solutions even more cost-effective, Ethereum can support the billions of transactions needed for true mainstream adoption without compromising on decentralization or security.
User and developer adoption of Layer 2 solutions has accelerated throughout 2025, with total value locked in these protocols reaching new highs. This migration to Layer 2 demonstrates that Ethereum’s scaling roadmap is working in practice, not just theory. As more applications and users embrace Layer 2 solutions, it reduces congestion on the base layer while maintaining economic activity within the Ethereum ecosystem.
The network effects created by this Layer 2 ecosystem strengthen Ethereum’s competitive position against other Layer 1 blockchains. Rather than being a single monolithic chain, Ethereum is evolving into a settlement layer for a diverse ecosystem of scaling solutions, each optimized for different use cases while sharing the security of the main network.
Historical Context: Comparing Current Conditions to Past Cycles
Examining historical price patterns provides a valuable perspective on whether current conditions represent routine volatility or something more concerning. Ethereum has experienced numerous corrections throughout its history, with many exceeding the current decline in magnitude. Understanding how past corrections resolved helps frame expectations for potential outcomes.
Looking at Ethereum’s performance during similar oversold conditions in previous years reveals that substantial rebounds often followed periods of maximum pessimism. However, the timing of these reversals varied significantly, with some occurring quickly while others required weeks or months of consolidation before sustainable rallies developed.
The broader crypto market cycle also provides context. Major cryptocurrencies tend to move through multi-year cycles of accumulation, expansion, distribution, and correction. Identifying where Ethereum sits within this larger cycle helps determine whether the current weakness represents a buying opportunity within an ongoing bull market or the beginning of a more sustained downturn.
Seasonal patterns in cryptocurrency markets add another layer of historical context. While past performance doesn’t guarantee future results, historical data shows certain months tend to be stronger or weaker for digital assets. Understanding these patterns helps set realistic expectations and can inform timing decisions for entering or exiting positions.
Conclusion
The current situation facing Ethereum represents a critical juncture that will likely determine near-term price direction. With prices holding precariously around $2,700 and multiple bearish technical signals in play, the risk of a decline toward $2,500 remains elevated. However, extreme oversold conditions, institutional interest through ETF flows, and upcoming network improvements provide reasons for cautious optimism about Ethereum’s longer-term prospects.
For traders and investors, the key lies in matching strategy to time horizon and risk tolerance. Short-term traders must respect the bearish momentum while watching for confirmation of reversal through improving technical indicators and volume patterns. Long-term investors should consider whether current valuations align with their fundamental thesis on Ethereum’s role in the future of finance and technology.
The next few days and weeks will prove crucial in determining whether buyers can successfully defend the $2,700 support zone and build a foundation for recovery, or if additional selling pressure will test lower support levels, including the psychologically significant $2,500 mark. Regardless of short-term volatility, Ethereum’s ongoing development, network upgrades, and growing ecosystem suggest that the project continues making progress on its long-term vision.
As always in cryptocurrency markets, maintaining discipline, managing risk appropriately, and avoiding emotional decision-making during periods of heightened volatility will serve investors better than attempting to perfectly time market movements. Whether Ethereum finds support here or tests lower levels, the combination of technical analysis, fundamental developments, and market sentiment will ultimately determine the path forward.
FAQs
Q: What is causing Ethereum’s current price weakness below $2,800?
Ethereum’s recent decline stems from multiple factors, including heavy selling pressure, ETF outflows that persisted for eight consecutive days before recently reversing, macroeconomic uncertainty around Federal Reserve policy, and technical breakdown below key support levels.
Q: Can Ethereum avoid falling to $2,500, and what support levels should traders watch?
Whether Ethereum can avoid $2,500 depends on buyers’ ability to defend current support zones. The immediate support exists between $2,680-$2,700, followed by the $2,623 level identified as critical by technical analysts. Historical liquidity zones sit at $2,681 and $2,606, representing areas where buyers have previously stepped in. T
Q: What do technical indicators suggest about Ethereum’s short-term price direction?
Current technical indicators present a mixed picture with both bearish and potentially bullish signals. The RSI at 29.19 indicates extreme oversold conditions, suggesting potential for a bounce as selling pressure may be reaching exhaustion. The MACD histogram remains negative but at levels that historically precede trend shifts.
Q: How might the upcoming Fusaka upgrade impact Ethereum’s price?
The Fusaka upgrade scheduled for December 3, 2025, could serve as a positive catalyst for Ethereum’s price by addressing critical scalability concerns. The upgrade aims to double blob capacity from 6 to 14 blobs per block through PeerDAS implementation, potentially reducing Layer 2 transaction fees by approximately 95% and enabling over 12,000 transactions per second by 2026.
Q: Should long-term investors consider current Ethereum prices a buying opportunity?
For long-term investors with appropriate risk tolerance, current Ethereum valuations may present accumulation opportunities, though timing remains uncertain. The extreme fear readings on the Fear & Greed Index (currently at 14) often coincide with local price bottoms, as excessive pessimism can create attractive entry points.