Bitcoin Down Today Why BTC Struggles at $103K Level
Bitcoin Down Today $100K for first time since June 2025. Discover why BTC price dropped to $103K, key factors driving the decline.

The cryptocurrency market entered turbulent waters in early November 2025, with Bitcoin experiencing its most significant downturn in months. The flagship digital currency, which once soared to record heights above $126,000 just weeks ago, now finds itself struggling to maintain support around the psychological $103,000 mark. This dramatic shift has left investors questioning what went wrong and whether the bull market that defined much of 2025 has finally come to an end.
Understanding the current Bitcoin price action requires examining multiple interconnected factors ranging from macroeconomic conditions to technical indicators, Bitcoin Down Today: institutional behavior, and broader market sentiment. The cryptocurrency that many believed would continue its unstoppable ascent has instead faced a harsh reality check, breaking below critical support levels and testing investor resolve like never before. This comprehensive analysis explores why Bitcoin is down today, what forces are pushing prices lower, and what the future might hold for the world’s largest cryptocurrency.
The Current State of Bitcoin Markets
Bitcoin continued its slide on November 4, 2025, falling below $102,000 and taking out the lows of the October 10 crash. The largest cryptocurrency plunged 4.5% over 24 hours and 11.8% over the past seven days to near $101,900, its weakest level since late June. This price action represents more than just a typical market correction—it signals a fundamental shift in market dynamics that has caught many traders off guard.
Bitcoin plunged below $100,000 for the first time in more than four months on November 4, as cryptocurrency holders backed off the risk-on asset amid growing concerns about the sustainability of stock valuations driven to stratospheric heights by the artificial intelligence trade. The breach of this psychologically important threshold has sent shockwaves through the crypto community, with many wondering if this marks the beginning of a prolonged bear market or merely a temporary setback.
The cryptocurrency market has witnessed significant volatility throughout this period, with other major digital assets following Bitcoin’s lead. Ethereum, the second-largest cryptocurrency, experienced even steeper losses, while smaller altcoins faced double-digit percentage declines. This broad-based selloff suggests that the issues plaguing Bitcoin extend beyond the asset itself, reflecting deeper concerns about the entire digital asset ecosystem and its relationship with traditional financial markets.
Federal Reserve Policy and Macroeconomic Pressures
One of the primary drivers behind Bitcoin’s recent weakness stems from shifting expectations around Federal Reserve monetary policy. The biggest influence on market sentiment right now is the uncertain policy path of the Federal Reserve. After a minor rate cut earlier this quarter, Fed officials have hinted that there may be no further easing in December. This hesitation has strengthened the US dollar and pushed up Treasury yields, a combination that typically drains liquidity from risk assets—including cryptocurrencies.
The relationship between Federal Reserve policy and Bitcoin prices cannot be overstated. When interest rates remain elevated and the central bank signals a “higher for longer” approach to monetary policy, investors naturally gravitate toward yield-bearing assets like Treasury bonds and away from non-yielding alternatives like Bitcoin. Federal Reserve Chair Jerome Powell’s comments last week walked back expectations of a December rate cut, reinforcing the “higher for longer” interest rate narrative. That shift has boosted the U.S. dollar while simultaneously pressuring non-yielding assets such as Bitcoin.
The strengthening US dollar has created additional headwinds for Bitcoin investment. As the greenback gains strength against other major currencies, dollar-denominated assets like Bitcoin become more expensive for international investors, reducing demand from overseas markets. This currency dynamic, combined with higher real yields on government bonds, has made the risk-reward calculation for holding Bitcoin less attractive in the current environment.
Moreover, the broader macroeconomic landscape presents challenges that extend beyond monetary policy alone. Concerns about persistent inflation, geopolitical tensions, and uncertainty about global economic growth have all contributed to a risk-off environment where investors prefer the relative safety of traditional assets over speculative investments in digital currencies.
Institutional Selling and ETF Outflows
The institutional landscape has undergone a dramatic transformation in recent weeks, with significant capital flowing out of Bitcoin investment vehicles. The US spot Bitcoin exchange-traded funds (ETFs) recorded $186.5 million in outflows on November 3, signaling renewed selling pressure across institutional products. Among individual issuers, BlackRock’s IBIT led the outflows with $186.5 million. These outflows represent a concerning shift in institutional sentiment, particularly given that ETF inflows had been a major catalyst for Bitcoin’s earlier rally in 2025.
ETF investors have withdrawn more than $1.8 billion from Bitcoin and Ether products over the past four trading days, while open interest in BTC perpetual futures has fallen about 30% from its October peak, signaling a pullback in leveraged exposure. This wholesale retreat by institutional investors suggests that sophisticated market participants are reassessing their exposure to cryptocurrency assets amid changing market conditions.
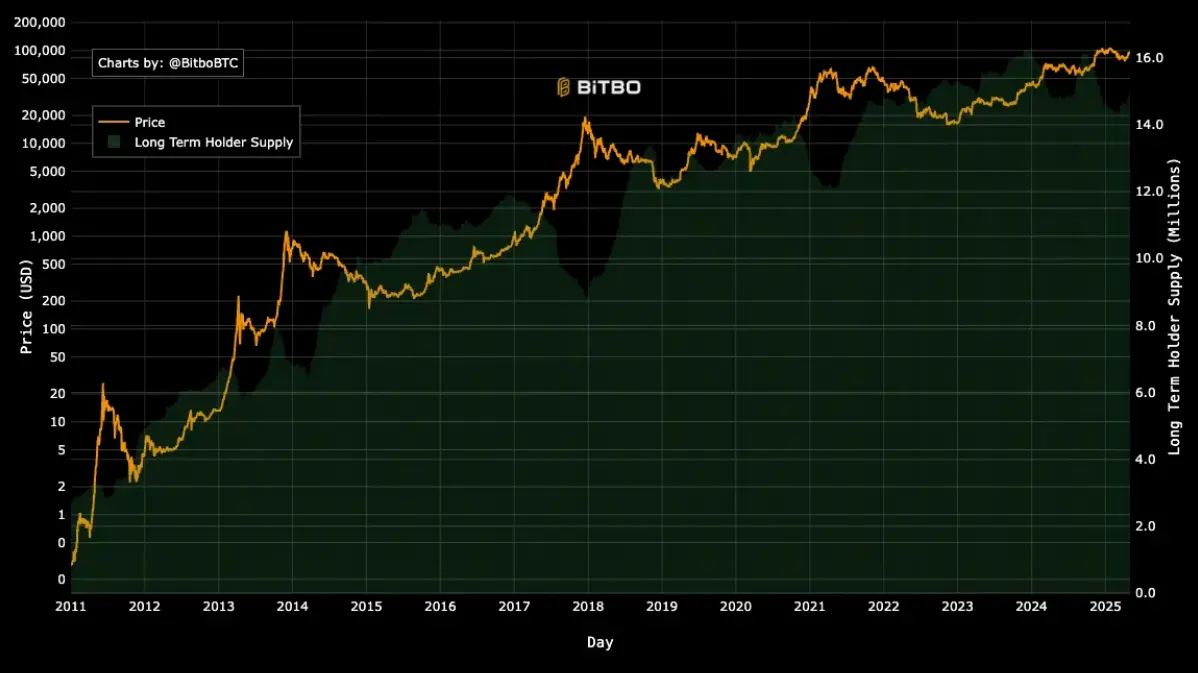
The behavior of long-term Bitcoin holders has also shifted noticeably. Compass Point analyst Ed Engel said individual investors may not be buying the dip as much as in the past. “While selling from Long-term Holders is a common feature in bull markets, retail spot buyers have been less engaged than prior cycles.” This lack of buying support from both retail and institutional investors has created a vacuum that allows prices to fall more rapidly when selling pressure emerges.
Adding to the institutional exodus, reports have surfaced of early Bitcoin adopters liquidating substantial holdings. BitcoinOG, who gained attention for profiting nearly $197 million by shorting the market in October, has repeatedly transferred BTC to major exchanges, including Binance, Coinbase, and Hyperliquid. When original holders begin distributing their coins after years of accumulation, it often signals a change in market structure that can precede extended periods of consolidation or decline.
Technical Breakdown and Market Structure: Bitcoin Down Today
From a technical perspective, Bitcoin’s price action has deteriorated significantly, breaking through multiple critical support levels that traders had relied upon. According to technical analysis, Bitcoin has fallen below the support grid marked by the 38.2% Fibonacci retracement, the 200-day exponential moving average (200 EMA), and horizontal levels. With the 200 EMA breakdown, Bitcoin has an open road to retesting the psychological $100,000 level—representing June lows, which combine with the 50% Fibonacci retracement.
The breach of the 200-day moving average is particularly concerning for technical traders, as this indicator has historically served as a dividing line between bull and bear markets. When Bitcoin trades below this level, it often signals that the intermediate-term trend has turned bearish, encouraging momentum traders to reduce their long positions or even establish short positions.
Vetle Lunde, head of research at K33, noted that “BTC has closed above $100,000 for 180 consecutive trading days, but is now dangerously close to this material psychological price level.” He argued that the current price action is typical of consolidations that followed major liquidation events of the past few years—”slow, heavy, and frustratingly choppy.” This observation suggests that the market may be undergoing a necessary reset after its rapid ascent earlier in the year.
The technical damage extends beyond simple price levels. The daily RSI has dropped below 46, showing fading buying strength, while the MACD lines are about to cross bearishly—a classic sign of trend exhaustion. The 50-day moving average (around $111,000) is now acting as resistance, while key support levels sit at $106,000, $75,000, and finally $66,000. These deteriorating technical indicators suggest that further downside may be in store if the market cannot find buyers willing to step in at current levels.
Market Sentiment and the Fear & Greed Index
Investor sentiment has deteriorated sharply alongside the price decline, creating a self-reinforcing cycle of negativity. The well-followed sentiment indicator, the Fear & Greed Index, fell to 21, indicating “extreme fear” on the market. That’s the metric’s most depressed reading since early April, when BTC fell below $75,000. This extreme fear reading reflects widespread uncertainty and anxiety among market participants about the future direction of prices.
The psychological impact of breaking below $100,000 cannot be understated. “Bitcoin and the broader crypto market is exhausted,” Haonan Li, founder of Ethereum-based stablecoin platform Codex, told CNBC. “Even with stablecoin growth, rising real-world asset volumes, and Bitcoin increasingly behaving like an institutional store of value—the market doesn’t care. Bad news is very bad for crypto right now… and good news barely moves the needle.”
This sentiment of exhaustion reflects a market that has lost its upward momentum despite what should be positive fundamental developments. The inability of good news to move prices higher while bad news triggers sharp selloffs is a classic characteristic of markets in transition from bull to bear phases. It suggests that the psychology of market participants has shifted from greed and optimism to fear and caution.
The correlation between Bitcoin and traditional markets has also intensified during this period. The leading cryptocurrencies attract many of the same investors as artificial intelligence stocks, linking the two trades when one goes bad. The Nasdaq Composite, home to the leading AI stocks, dropped more than 1% on November 4, with investors selling AI-linked stocks on concerns about valuations. This correlation means that weakness in equity markets, particularly technology stocks, tends to spill over into cryptocurrency markets, creating additional downside pressure.
Historical Context and Seasonal Patterns
The current market dynamics become even more concerning when viewed through the lens of historical seasonal patterns. October has historically delivered gains of 19.92% on average, while 2025 recorded a loss of 3.69%, representing a 23.61 percentage point underperformance relative to historical patterns. This deviation from typical seasonal strength suggests that the market is operating under unusual conditions that override normal cyclical patterns.
Bitcoin’s price has largely trended downward over the past few weeks, with October’s historically strong seasonality failing to materialize this year. Bitcoin last failed to rise on seasonal tailwinds in October 2018. In the month that followed, Bitcoin plunged 37% in November of that year. This historical parallel is particularly worrying for Bitcoin bulls, as it suggests that when October weakness occurs, November can bring even more substantial declines.
The comparison to previous market cycles raises questions about whether Bitcoin has already peaked for this cycle. Some analysts have pointed to four-year halving cycles as evidence that Bitcoin may have already reached its top. The theory suggests that Bitcoin typically peaks approximately 500-550 days after its halving event, and the current cycle has now reached that window. If this pattern holds, it would imply that the bull market has concluded and that a prolonged consolidation or bear market phase may be beginning.
Potential Downside Targets and Risk Scenarios
Technical analysts have identified several potential price targets if Bitcoin continues its decline. If Bitcoin doesn’t hold the psychological $100,000 level, a sustained break would open the path to the first target zone at $92,000-$94,000 (61.8% Fibonacci retracement combined with 100% Fibonacci extension), representing late April and early May lows. From there, the ultimate downside targets sit at $74,000-$77,000, this year’s April lows, where the 161.8% Fibonacci extension falls.
Such a decline would represent a dramatic reversal of fortune for Bitcoin. This would mean Bitcoin could slide from $104,000 levels by almost 30%, erasing the entire upward rally observed over the last six months when it gained a total of 70%. While this represents a severe correction, it would align with historical Bitcoin drawdown patterns during past cycles. For investors who entered positions during the recent highs, such a scenario would result in substantial paper losses and could trigger further capitulation selling.
The probability of such an outcome has increased according to prediction markets. Reports suggest that betting markets now assign a high probability to Bitcoin falling below $100,000 before the end of 2025. This shift in market expectations reflects the deteriorating technical picture and the absence of obvious catalysts that could reverse the current downtrend.
However, it’s important to note that markets rarely move in straight lines. Lunde at K33 suggested that it’s too early to call October 6 the market top. Positive catalysts—such as expected monetary easing, retirement accounts potentially opening for crypto, growing institutional participation and regulatory softening—don’t support the idea of a cyclical top. These fundamental factors remain in place and could eventually provide support for prices, even if the near-term outlook appears challenging.
Liquidity Conditions and Leveraged Positions
The cryptocurrency market’s liquidity profile has undergone significant changes that have amplified price movements in both directions. Thin liquidity, particularly during certain trading sessions, has made Bitcoin more susceptible to sharp price swings. The unwinding of leveraged positions has accelerated this volatility, as traders who borrowed money to amplify their bets are forced to close positions when prices move against them.
The derivatives market provides insight into the positioning of sophisticated traders. Open interest in BTC perpetual futures has fallen about 30% from its October peak, signaling a pullback in leveraged exposure. This deleveraging process is a natural consequence of declining prices, but it also removes buying power from the market that had previously helped support higher valuations.
Funding rates in perpetual futures markets have normalized from the elevated levels seen during the bull market, indicating a more balanced mix of long and short positions. While this balance is healthier for long-term market stability, it also means that there is less reflexive short-covering to power rapid price rebounds when markets dip. This shift in market structure makes it more difficult for Bitcoin to stage the type of V-shaped recoveries that characterized earlier stages of the bull market.
The Broader Cryptocurrency Ecosystem
The challenges facing Bitcoin have extended throughout the broader digital asset market. Major altcoins have experienced even steeper declines than Bitcoin, with some suffering double-digit percentage losses in a matter of days. This broad-based weakness suggests that the issues aren’t specific to Bitcoin but rather reflect a general reassessment of cryptocurrency valuations across the board.
The performance of the overall crypto market cap provides additional context for Bitcoin’s struggles. The total value of all cryptocurrencies has declined substantially from its peaks, with hundreds of billions of dollars in value evaporating as investors exit the space. This contraction in total market value reflects not just price declines but also reduced speculative activity and lower trading volumes across the ecosystem.
Interestingly, stablecoin activity has remained relatively robust during this period. Demand for stablecoins is quietly rising. USDT, USDC, and USDe now account for almost 3% of total market capitalization, suggesting traders are holding liquidity off-exchange—ready to re-enter the market when volatility subsides. Historically, this pattern often signals reaccumulation, as institutions tend to wait for technical confirmation before returning to risk assets. This accumulation of dry powder could eventually provide fuel for a market recovery, though the timing remains uncertain.
Conclusion
Bitcoin’s decline to the $103,000 level and subsequent break below $100,000 represents a significant shift in market dynamics that has caught many investors off guard. The convergence of unfavorable macroeconomic conditions, institutional selling pressure, technical breakdowns, and deteriorating market sentiment has created a perfect storm that has overwhelmed the fundamental bullish factors that drove Bitcoin’s earlier gains in 2025.
Dollar strength plus ambiguous growth data equals tighter financial conditions and a lower “risk budget.” Until this shifts, crypto rallies are more likely to fade at resistance than break cleanly. This environment suggests that recovery may take time and will likely require either a fundamental shift in Federal Reserve policy, renewed institutional buying, or technical stabilization at lower price levels before a sustainable rally can emerge.
For investors navigating these turbulent waters, the key is maintaining perspective and understanding that volatility is an inherent characteristic of cryptocurrency markets. While the near-term outlook appears challenging, with potential for further downside if key support levels fail, the long-term fundamental case for Bitcoin—including its fixed supply, growing adoption, and potential as a hedge against monetary debasement—remains intact. The question is not whether Bitcoin will recover, but rather when and from what price level that recovery will begin.
As November progresses, market participants will be closely watching several key factors: Federal Reserve communications and economic data that could influence monetary policy expectations, ETF flow data that provides insight into institutional sentiment, technical price levels that could trigger either capitulation selling or buying interest, and overall risk appetite in traditional financial markets. The interplay of these factors will ultimately determine whether Bitcoin can stabilize around current levels or whether further declines lie ahead.
FAQs
Q1: Why is Bitcoin falling in November 2025?
Bitcoin is falling due to multiple factors, including uncertain Federal Reserve policy that has strengthened the dollar and raised real yields, significant institutional selling through ETF outflows exceeding $1.8 billion over recent days, technical breakdowns below the critical 200-day moving average, and deteriorating market sentiment reflected in extreme fear readings. The convergence of these macroeconomic and technical factors has created sustained selling pressure.
Q2: Will Bitcoin fall below $100,000?
Bitcoin has already broken below $100,000 for the first time since June 2025. Technical analysts suggest that if this level fails to hold as support, the next targets could be $92,000-$94,000, with ultimate downside risk to the $74,000-$77,000 range. However, some analysts believe positive fundamental factors like institutional adoption and regulatory clarity could provide support and limit downside.
Q3: Is this the end of the Bitcoin bull market?
The question of whether the bull market has ended remains debated. Some analysts point to historical four-year cycle patterns suggesting Bitcoin may have peaked, while others argue that fundamental catalysts like potential monetary easing, growing institutional participation, and regulatory improvements indicate it’s too early to declare the bull market over. Current conditions suggest at least a significant consolidation phase is underway.
Q4: What are the main factors affecting Bitcoin price right now?
The primary factors affecting Bitcoin include Federal Reserve monetary policy and the stronger dollar, institutional ETF outflows, and reduced buying from both retail and institutional investors, technical breakdowns below key support levels, correlation with declining AI and technology stocks, extreme fear sentiment, and the unwinding of leveraged positions in derivatives markets. These factors have combined to create sustained downward pressure.
Q5: When will Bitcoin recover from its current decline?
The timing of a Bitcoin recovery is uncertain and will depend on several factors, including stabilizing or reversing. Key catalysts could include signs of Federal Reserve policy easing, renewed institutional buying through ETF inflows, technical stabilization at lower support levels, improved risk appetite in broader financial markets, or positive regulatory developments.