Bitcoin Charts Mirror 2025 $68K Test Ahead
Bitcoin Charts Mirror trends as analysts predict a critical $68K retest. Discover what historical charts reveal about BTC's next move.

Bitcoin’s price action has caught the attention of seasoned traders and analysts who notice striking similarities between current chart patterns and those observed during the tumultuous year of 2022. As the world’s leading digital asset approaches a critical juncture, market participants are closely monitoring whether history will repeat itself, particularly as a potential test of the $68,000 price level becomes increasingly probable.
The parallels between today’s market structure and the 2022 trajectory could provide valuable insights into Bitcoin’s near-term direction, helping investors make informed decisions during this pivotal moment. The convergence of technical indicators, on-chain metrics, and historical precedents creates a compelling narrative that demands careful examination. Bitcoin Charts Mirror: As we delve into this analysis, we’ll explore how current Bitcoin price movements mirror past behaviors and what this means for the broader cryptocurrency ecosystem.
The 2025 Market Structure: Bitcoin Charts Mirror
To appreciate the current situation, we must first revisit the landscape of 2022, a year that tested the resolve of even the most steadfast Bitcoin believers. The cryptocurrency market experienced one of its most challenging periods, with Bitcoin plummeting from its all-time high of approximately $69,000 in November 2021 to lows near $15,500 by the end of 2022. This dramatic decline wasn’t a simple straight-line drop but rather a complex series of rallies, rejections, and consolidation phases that created distinct chart patterns.
During 2022, Bitcoin exhibited what technical analysts call a “stair-step decline”—periods of sharp selling followed by brief relief rallies that ultimately failed to sustain upward momentum. Key resistance levels were established, tested multiple times, and consistently rejected. The market showed characteristics of accumulation zones at lower levels, where long-term holders added to positions while short-term traders capitulated. Volume patterns during this period revealed decreasing interest during rallies and increasing pressure during selloffs, a classic bearish signature.
The macroeconomic backdrop of 2022 played a crucial role in shaping Bitcoin’s trajectory. Rising interest rates, persistent inflation concerns, and a flight to safety in traditional markets created headwinds for risk assets, including cryptocurrencies. The correlation between Bitcoin and equity markets strengthened considerably, diminishing the narrative of BTC as an inflation hedge or uncorrelated asset. These factors combined to create a perfect storm that defined the year’s price action.
Current Chart Patterns: Déjà Vu in Motion

Fast forward to the present market environment, and the similarities between current Bitcoin chart patterns and those from 2022 are becoming increasingly difficult to ignore. Technical analysts have identified several key parallels that suggest we may be entering a phase reminiscent of that earlier period. The current price structure shows comparable consolidation patterns, similar rejection points at critical resistance levels, and volume profiles that echo the distribution phases observed during the 2022 decline.
One of the most striking similarities involves the formation of descending triangle patterns on multiple timeframes. In 2022, Bitcoin formed several descending triangles before breaking down to lower levels. Current charts display similar formations, with horizontal support levels being tested repeatedly while the upper resistance trendline slopes downward. This pattern typically indicates weakening buying pressure and potential continuation of downward trends if the support eventually breaks.
The relative strength index (RSI) and other momentum indicators are painting a familiar picture as well. Just as in 2022, current readings show divergences between price and momentum, suggesting that each successive rally attempt is accompanied by diminishing strength. The moving average convergence divergence (MACD) histogram displays patterns of contraction that preceded significant moves in the 2022 market cycle. These technical signatures don’t guarantee identical outcomes, but they certainly warrant attention from anyone tracking Bitcoin’s price trajectory.
Volume analysis adds another layer to this comparison. The current market is experiencing declining volume on upward price movements and increasing volume during pullbacks—a distribution pattern that characterized much of 2022’s downtrend. This suggests that sellers are more aggressive than buyers at current price levels, creating an imbalance that could lead to further testing of support zones.
The Significance of the $68K Level
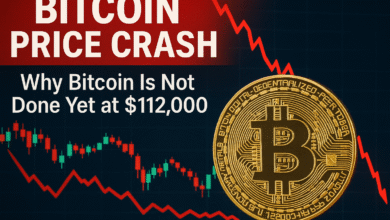
The $68,000 price point holds particular significance in Bitcoin’s history and technical structure. This level represents not just a psychological milestone but also a critical technical zone that has acted as both strong support and formidable resistance in previous cycles. Understanding why this level matters requires examining both its historical context and its relationship to current market dynamics.
From a historical perspective, the $68K region was where Bitcoin established its previous all-time high territory before the 2022 decline began. Price levels near previous all-time highs often become magnets during recovery phases as traders who bought at those levels look for opportunities to exit at breakeven. This creates what’s known as “trapped supply”—Bitcoin holders waiting to sell once prices return to their entry points. The clustering of limit sell orders around these psychological levels can create significant resistance that prevents easy breakouts.
Technical analysis reveals that $68K aligns with several important Fibonacci retracement levels and represents a critical junction of multiple moving averages on higher timeframes. When price approaches such confluence zones, the likelihood of significant reactions increases substantially. Bulls view reclaiming this level as essential for validating a new uptrend and potentially triggering a FOMO rally (fear of missing out) among sidelined investors. Conversely, bears see rejection at this level as confirmation of continued distribution and weakness.
The concept of a “retest” is crucial here. In technical analysis, when an asset breaks down from a significant support level, that level often becomes resistance when revisited from below. If Bitcoin is indeed mirroring 2022 patterns, a test of $68K from current levels would represent exactly this type of retest scenario—an opportunity for the market to determine whether former support can be reclaimed or if it will now act as a ceiling on price appreciation.
On-Chain Metrics and Market Sentiment
Beyond traditional technical analysis, on-chain data provides additional context for evaluating the 2022 pattern comparison. Blockchain analytics reveal the behavior of different market participant groups, offering insights that pure price charts cannot capture. Current on-chain metrics show several parallels to the 2022 environment that strengthen the case for similar price patterns unfolding.
Exchange inflows and outflows, which measure Bitcoin moving to and from cryptocurrency exchanges, display patterns consistent with distribution phases. Increased inflows to exchanges typically suggest potential selling pressure as holders move coins to platforms where they can be sold. Recent data shows elevated exchange inflows at price rallies, mirroring the pattern observed during 2022’s relief rallies that ultimately failed. This suggests that investors are using price strength as exit opportunities rather than accumulation points.
The MVRV ratio (Market Value to Realized Value), which measures whether Bitcoin is overvalued or undervalued relative to its on-chain cost basis, currently sits in a range that preceded significant corrections in 2022. When this metric enters elevated territory, it indicates that the average holder is sitting on substantial unrealized profits, increasing the temptation to take profits. Similar readings in 2022 preceded several notable selloffs as profit-taking overwhelmed buying demand.
Wallet behavior analysis reveals another interesting parallel. The number of addresses holding Bitcoin for less than six months—typically considered short-term holders—has increased relative to long-term holder addresses. This shift toward shorter holding periods suggests a more speculative mindset among recent buyers, similar to the environment that prevailed during 2022’s distribution phase. Long-term Bitcoin holders, often called “HODLers,” showed net accumulation during 2022’s lows but distribution during rallies, and current data suggests a similar pattern may be emerging.
Sentiment indicators drawn from social media analysis, Google search trends, and survey data also echo 2022 patterns. The “Crypto Fear and Greed Index,” which aggregates various sentiment measures, shows readings fluctuating between fear and neutral—never reaching the extreme greed levels that typically mark major tops but also not descending into the capitulation panic that often signals bottoms. This middle-ground sentiment is characteristic of transitional phases where the market direction remains uncertain, exactly as it was during much of 2022.
Macroeconomic Factors and Institutional Dynamics
The broader economic environment plays a critical role in shaping Bitcoin’s trajectory, and current macroeconomic conditions bear some resemblance to those that prevailed in 2022. Understanding these parallels helps contextualize why similar price patterns might emerge even as the specific circumstances differ in certain respects.
Interest rate policy remains a central factor influencing cryptocurrency markets. While the Federal Reserve’s aggressive rate hiking cycle of 2022 has concluded, the current environment of “higher for longer” interest rates continues to create headwinds for speculative assets like Bitcoin. Elevated rates increase the opportunity cost of holding non-yielding assets and strengthen the dollar, both of which can pressure cryptocurrency prices. The persistence of restrictive monetary policy creates a macro backdrop that, while not identical to 2022, shares important characteristics that impact risk sentiment.
Institutional adoption of Bitcoin has evolved significantly since 2022, with the approval of spot Bitcoin ETFs representing a watershed moment for the asset class. However, institutional flows into these vehicles have been more variable than many anticipated, showing periods of strong inflows followed by notable outflows. This pattern of inconsistent institutional demand creates uncertainty that can contribute to choppy price action and range-bound trading—characteristics that defined much of 2022’s market environment.
Regulatory developments continue to shape market dynamics in ways reminiscent of 2022’s uncertainty. While the regulatory landscape has arguably improved in some jurisdictions, ongoing enforcement actions, legislative debates, and international coordination efforts create an environment of persistent uncertainty. This regulatory overhang affects institutional participation and can dampen retail enthusiasm, contributing to the cautious market sentiment reflected in current price patterns.
What History Suggests About Near-Term Price Action

If current patterns continue to mirror 2022’s trajectory, what might investors reasonably expect in terms of near-term Bitcoin price action? While past performance never guarantees future results, historical analysis provides a framework for considering probable scenarios and preparing appropriate risk management strategies.
The base case scenario, extrapolating from 2022 patterns, suggests continued consolidation with a bias toward testing lower support levels before any sustainable uptrend can establish itself. In 2022, each rally attempt that failed at resistance led to renewed testing of support, with breaks of support levels leading to accelerated declines to the next major support zone. If this pattern holds, failure to reclaim the $68K level could trigger similar cascading movements as stop losses are hit and momentum traders reverse their positions.
However, important differences between 2022 and the current environment should not be overlooked. The Bitcoin halving event that occurred in 2024 creates different supply dynamics than existed in 2022. Historically, the 12-18 months following halving events have been positive for Bitcoin prices, though this doesn’t preclude interim corrections. Additionally, the development of layer-2 solutions, growing institutional infrastructure, and expanding use cases provide fundamental support that arguably wasn’t as developed in 2022.
Volume will be a critical factor to monitor as price approaches key levels. In 2022, breakdowns from consolidation patterns were typically accompanied by expanding volume, confirming the validity of the moves. If current patterns develop similarly, traders will watch for volume surges on any breakdown below major support or on any breakout above resistance. Lack of volume on attempted moves in either direction would suggest indecision and potentially false breakouts or breakdowns.
The $68K retest, should it occur, will likely prove a decisive moment. A clean reclaim of this level accompanied by strong volume and improving on-chain metrics could invalidate the 2022 comparison and signal that Bitcoin is establishing a new phase of its market cycle. Conversely, rejection at this level with the characteristics observed during 2022’s failed rallies would strengthen the bear case and suggest further downside exploration lies ahead.
Alternative Scenarios and Risk Considerations
While the 2022 pattern comparison provides a valuable analytical framework, responsible market analysis requires considering alternative scenarios that could unfold differently from historical precedents. The cryptocurrency market has demonstrated repeatedly that while patterns may rhyme, they rarely repeat exactly, and unexpected catalysts can rapidly alter market trajectories.
One alternative scenario involves a swift catalyst-driven breakout that invalidates the pattern comparison. Cryptocurrency markets are particularly susceptible to sudden regime changes driven by regulatory clarity, major institutional announcements, technological breakthroughs, or macroeconomic surprises. A unexpected shift in Federal Reserve policy, for instance, could trigger a risk-on environment that propels Bitcoin higher regardless of technical patterns suggesting otherwise.
The growing influence of spot Bitcoin ETFs creates dynamics that didn’t exist in 2022 and could lead to different outcomes. If major wealth management platforms suddenly encourage advisor allocation to Bitcoin ETFs, the resulting inflows could overwhelm technical resistance levels. Similarly, corporate treasury adoption by additional major companies could create buying pressure that negates bearish technical setups.
Risk management remains paramount regardless of which scenario ultimately unfolds. Traders and investors should avoid over-committing capital based on any single analytical framework, including pattern recognition. Position sizing, stop-loss placement, and portfolio diversification become especially important when historical patterns suggest increased volatility ahead. The 2022 market taught many participants painful lessons about leverage and overconcentration—lessons that remain relevant today.
Conclusion
The striking similarities between current Bitcoin chart patterns and those observed during 2022 create a compelling analytical framework that deserves serious consideration from anyone involved in cryptocurrency markets. From technical formations and volume profiles to on-chain metrics and sentiment indicators, multiple data streams suggest we may be navigating familiar territory. The looming test of the $68K level represents a critical juncture that could determine Bitcoin’s direction for months to come.
However, pattern recognition must be balanced with recognition of the unique aspects of the current environment. The cryptocurrency ecosystem has matured significantly since 2022, with improved infrastructure, growing institutional participation, and evolving regulatory frameworks. These factors create both opportunities and risks that may cause the current cycle to deviate from historical precedents in important ways.
Ultimately, whether Bitcoin follows the 2022 playbook or carves a different path, the market will be shaped by the interplay of technical factors, fundamental developments, and the collective psychology of millions of participants making decisions under uncertainty. By understanding historical patterns while remaining flexible to new information, investors can navigate this challenging environment with eyes wide open to both the risks and opportunities that lie ahead. The coming weeks and months will reveal whether history is indeed repeating or merely rhyming as Bitcoin approaches its critical $68K test.
FAQs
Q: What specific chart patterns from 2022 are currently appearing in Bitcoin’s price action?
The most prominent patterns include descending triangles on multiple timeframes, declining volume on upward price movements, and momentum divergences on indicators like RSI and MACD. These patterns are appearing in similar sequences to those observed during 2022’s distribution phase, with horizontal support levels being repeatedly tested while upper resistance slopes downward.
Q: Why is the $68,000 level so important for Bitcoin’s future price movement?
The $68K level holds multiple layers of significance. It represents the approximate area of Bitcoin’s previous all-time high, making it a psychologically important zone where many investors may have limit sell orders placed. From a technical perspective, this level aligns with key Fibonacci retracement levels and represents a confluence of important moving averages.
Q: How do current on-chain metrics compare to those from 2022?
Current on-chain metrics show several parallels to 2022, including elevated exchange inflows during price rallies (suggesting distribution), MVRV ratios in zones that preceded corrections, and a shift toward shorter holding periods among address cohorts. However, some metrics show improvement, particularly in terms of supply held by long-term holders at certain price ranges.
Q: Could the 2024 halving event prevent Bitcoin from following the 2022 pattern?
The halving event creates a fundamental difference between the current environment and 2022, as the reduction in new Bitcoin supply typically creates positive price pressure over medium to long timeframes. Historically, the 12-18 months following halving events have been bullish for Bitcoin. However, halving effects often take time to manifest in price action, and interim corrections remain possible.
Q: What risk management strategies should investors employ given these pattern similarities?
Investors should consider several risk management approaches, including appropriate position sizing relative to overall portfolio allocation, setting stop-loss orders at technically relevant levels below key support zones, avoiding excessive leverage that could lead to forced liquidations during volatility, and maintaining portfolio diversification beyond cryptocurrencies alone. For those with longer time horizons, dollar-cost averaging can help smooth out entry points during uncertain periods.